Expansive Population Pyramid: Meaning, Causes, and Examples
Learn how to identify an expansive population pyramid, what its broad base can and cannot reveal, and how fertility, survival, and momentum shape it.
An expansive population pyramid has a broad base and progressively smaller cohorts at older ages. The shape tells you that children and young people form a large share of the population. It does not, by itself, tell you why that structure exists or guarantee a particular future.
The most defensible interpretation is therefore descriptive first: recent birth cohorts are large relative to the adult cohorts above them. High fertility is a common explanation, improving child survival may reinforce the pattern, and the resulting age structure creates population momentum as large cohorts move into adulthood.
How to recognize an expansive pyramid
Look for several signals together rather than relying on a triangle-like silhouette:
- The 0–4, 5–9, and 10–14 groups occupy a large combined share.
- Cohorts generally become smaller with increasing age.
- The median age is low because half the population is concentrated below a young age.
- The population aged 65 or older forms a small share.
- The child dependency component is much larger than the old-age component.
An irregular notch or a single wide bar does not define the type. Work through the whole distribution, check both sexes, and compare at least two years.
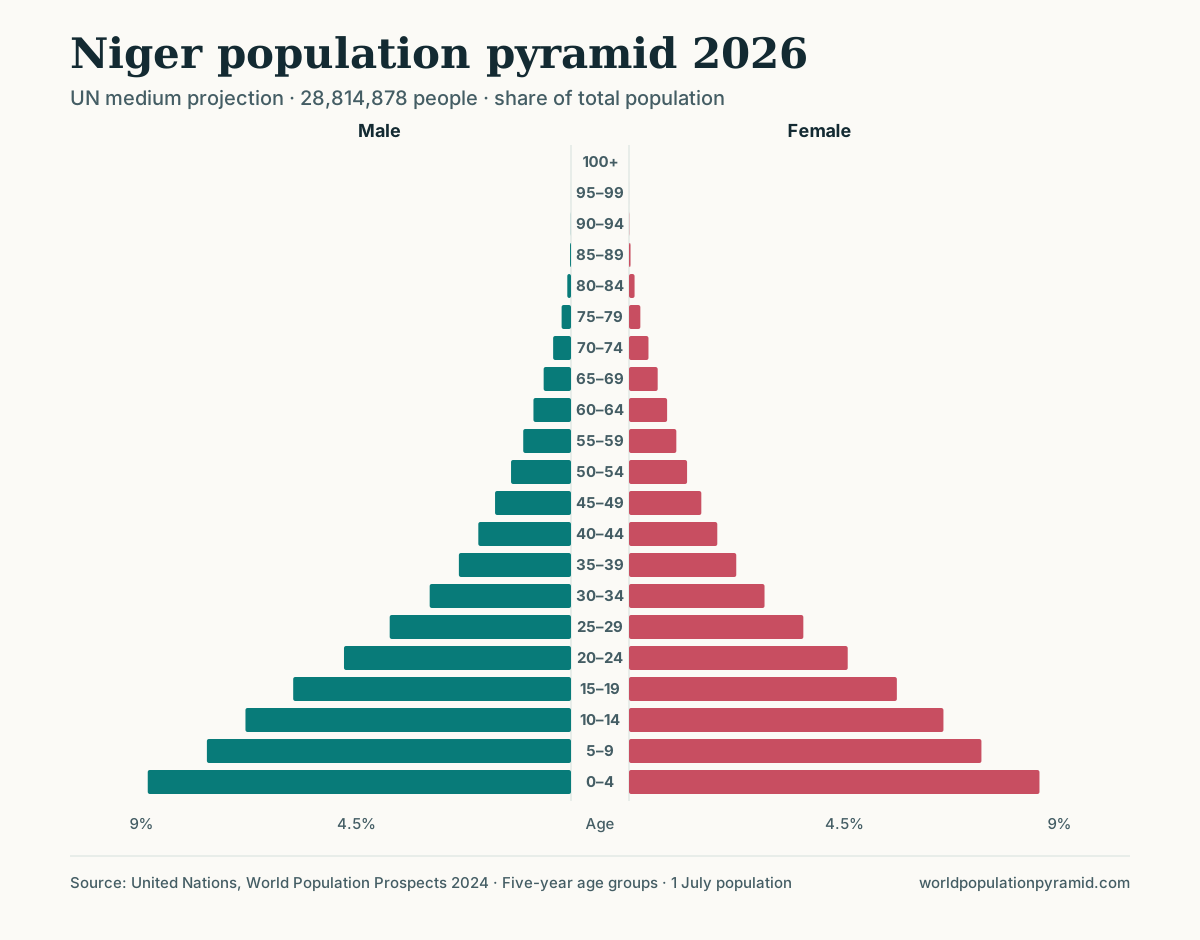
Niger meets all five signals in the 2026 projection: about 46% of its population is under 15, only about 2.6% is 65 or older, and the median age is 15.7 years.
A measured example: Central African Republic in 2026
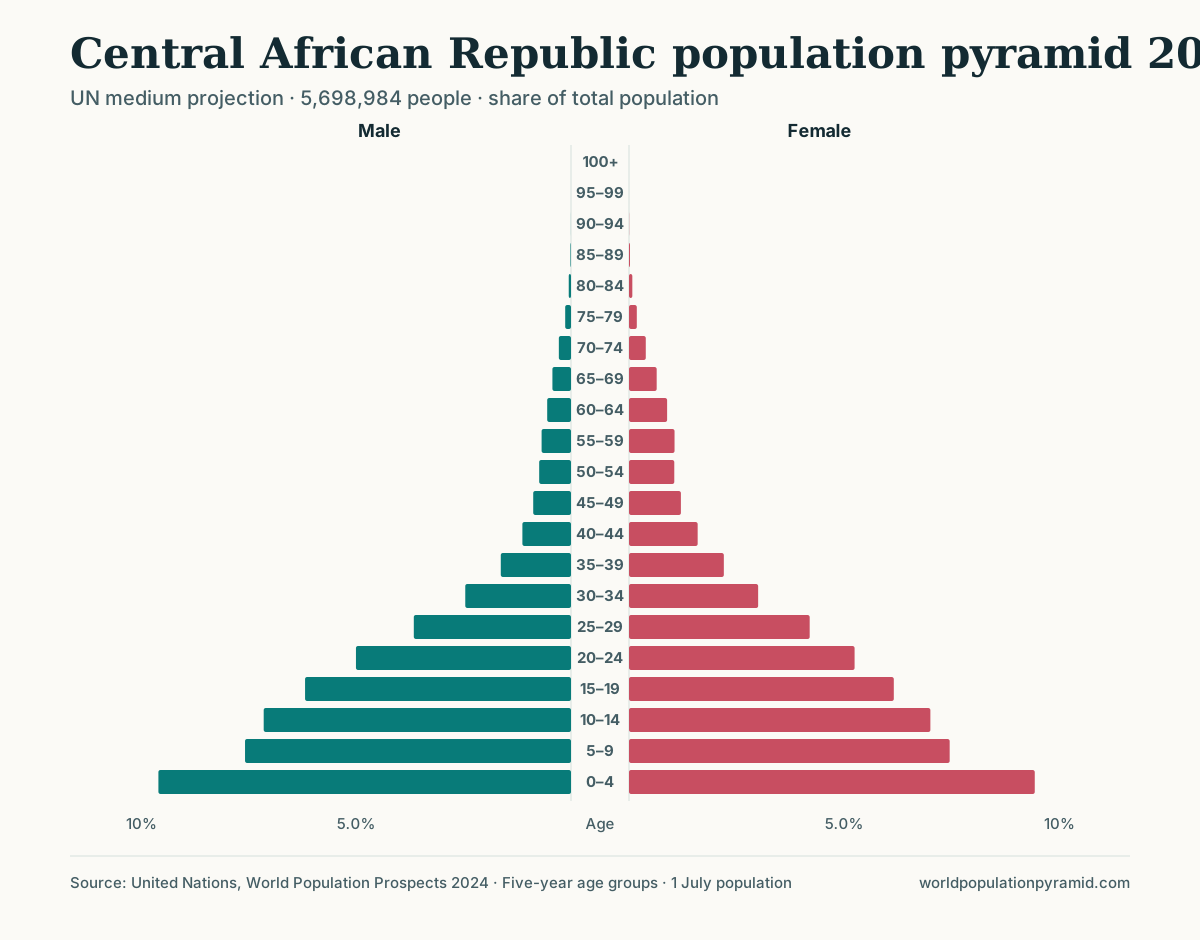
The UN medium projection for the Central African Republic in 2026 provides a clear broad-based example:
| Measure | 2026 value |
|---|---|
| Population aged 0–14 | 48.2% |
| Population aged 15–64 | 49.5% |
| Population aged 65+ | 2.2% |
| Median age | 14.6 years |
| Total fertility rate | 5.69 births per woman |
| Annual population growth | 3.28% |
The 0–4 group alone accounts for about 19% of the population, compared with roughly 14% aged 10–14 and 10% aged 20–24. That downward progression with age creates the expansive outline. Open the Central African Republic profile to inspect exact male and female counts and compare 2000, 2026, and 2050.
These figures are mutually reinforcing, but they are not interchangeable. The fertility rate describes current age-specific fertility. The child share summarizes age composition. The growth rate incorporates births, deaths, and migration. The chart is the accumulated result of many years, not a picture of one year’s fertility alone.
What produces the broad base
Large recent birth cohorts
When births remain numerous relative to the existing population, the youngest bars are wide. Total fertility rate is relevant, but the number of potential parents also matters. A large generation entering reproductive ages can produce many births even while the average number of births per woman is falling.
More children surviving
A population can become more expansive during the early part of a mortality transition. If infant and child mortality fall while fertility remains high, more children survive into every successive age band. The widening young population can accelerate growth before fertility later declines.
Population momentum
Age structure carries its own inertia. A large child generation eventually becomes a large generation of adults. Even if each future adult has fewer children than the previous generation, the number of potential parents may keep births and total population rising. This is population momentum, and it is why “fertility is falling” does not necessarily mean “population will soon stop growing.”
Migration—sometimes
International migration is often concentrated at young adult ages, so it more commonly changes the middle than the base. Family migration and return migration can still affect children’s cohorts. The pyramid displays the resulting stocks, not the flows or motives, so a migration source is needed before assigning causation.
What the shape does not prove
An expansive pyramid does not by itself prove:
- that fertility is currently rising;
- that every region within the country has the same structure;
- that mortality is high at every age;
- that the population will maintain its present growth rate;
- that a country is poor, unstable, or at a particular level of development;
- that a large youth population will automatically produce either an economic dividend or social strain.
Those conclusions require additional evidence. Education, health, employment, institutions, household arrangements, urbanization, and migration affect outcomes that cannot be read directly from age bars.
Child dependency is a composition measure
In a strongly expansive population, the age-dependency ratio is usually dominated by children. For the Central African Republic example, children under 15 are almost as numerous as the entire 15–64 population. That indicates a high ratio of child-age people to conventional working-age people.
It does not count actual earners or dependants. Some people aged 15–64 are students or are outside paid employment; some people over 65 work; and children’s care is not supplied only through formal labor income. Use the ratio to compare age structures, not to calculate a household’s economic burden.
How an expansive pyramid changes over time
Do not assume the pyramid simply becomes smaller. During fertility decline, the base may narrow as total population continues to grow. Earlier large cohorts move upward, producing a bulge through school ages, working ages, and eventually older ages.
A useful time comparison asks:
- Is the 0–4 group smaller than the 5–9 group?
- Is the child share falling even though the number of children is rising?
- Is the working-age share increasing as past child cohorts mature?
- Does the 2050 projection remain broad-based or become more columnar?
- How much does the result depend on the projection scenario?
For the Central African Republic, the medium projection keeps a broad base in 2050, but the bands below age 25 become much more similar in width as the child share falls to about 38%.
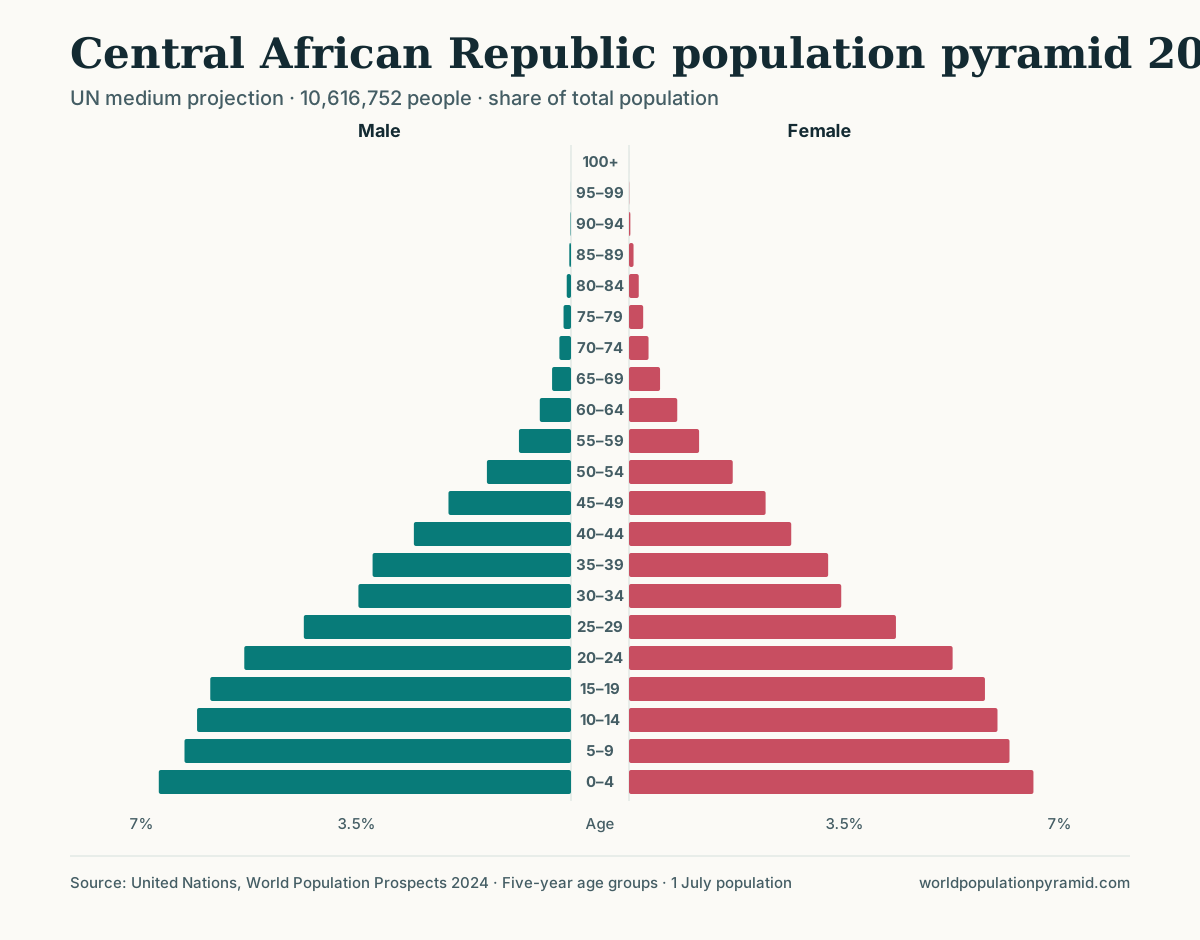
The percentage view is best for comparing shape. Counts are necessary for planning how many schools, jobs, homes, or health services may be needed.
A common counterexample: the working-age bulge
A country with a large migrant workforce can have an extremely wide middle and very small child and older shares. That is not an expansive pyramid in the usual textbook sense, even if its total population is growing quickly. Qatar and the United Arab Emirates are prominent examples in the 2026 data: their working-age shares exceed 80%, and their male sides are especially wide at young adult ages.
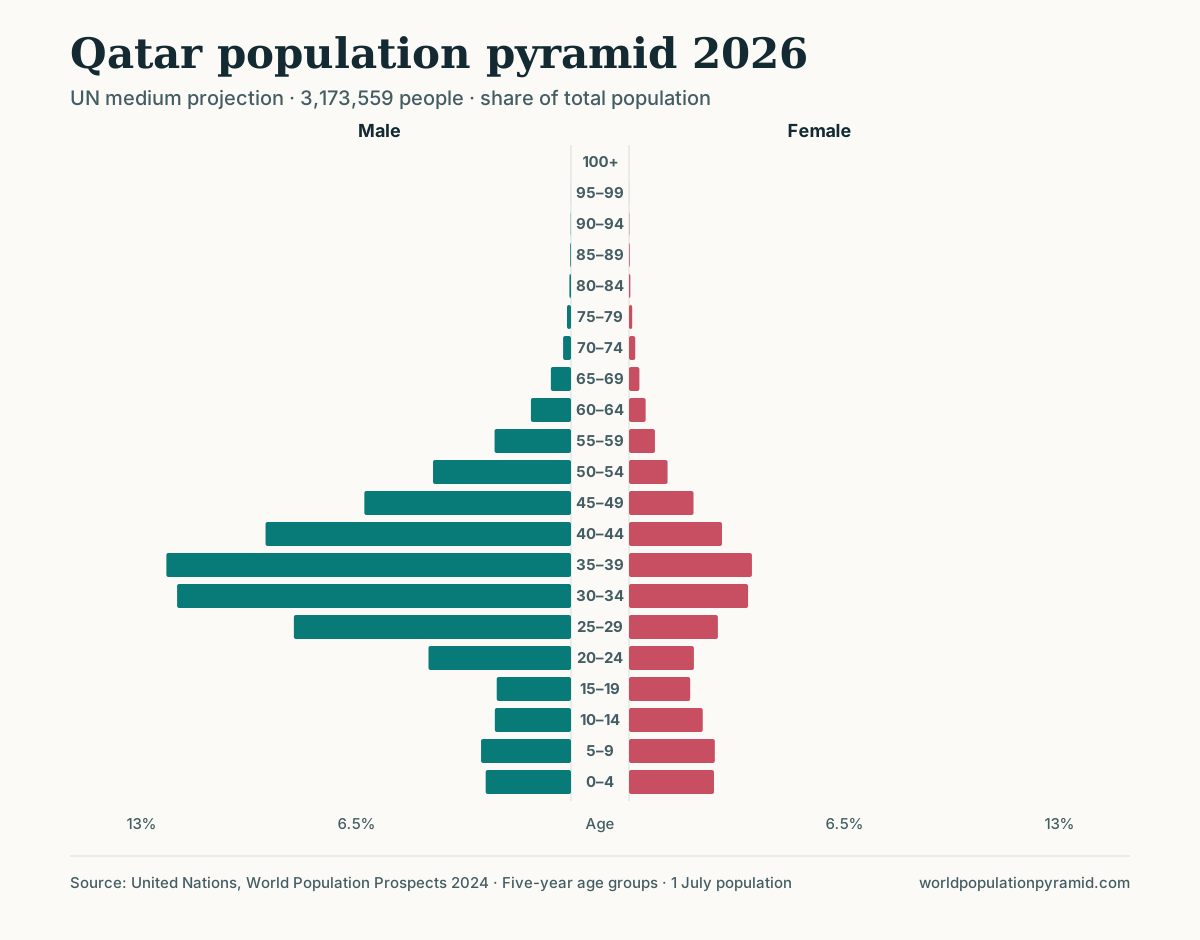
This counterexample matters because it separates three concepts that are often collapsed:
- a broad base describes large child cohorts;
- a high growth rate describes annual population change;
- a wide working-age middle may be shaped heavily by migration.
A reliable way to describe the chart
An evidence-based interpretation can be written in four steps:
- Describe: “The three child cohorts form a broad base, and cohorts generally narrow with age.”
- Measure: Give the under-15 share, median age, fertility rate, and annual growth rate.
- Compare: State whether the base is wider or narrower than in an earlier year and under the 2050 projection.
- Qualify: Explain that fertility, mortality, and migration data are needed to identify causes and that future values are scenario-dependent.
That is more informative than assigning a shape label and stopping there.
Sources and further reading
- United Nations World Population Prospects 2024 — age, sex, fertility, mortality, and population series used for the example.
- WPP 2024 methodology report — how UN estimates and projections are produced.
- United Nations World Social Report 2023 — age structure across demographic transition.
- U.S. Census Bureau population-pyramid teaching activity — methods for calculating and comparing age-sex shares.
Frequently asked questions
What does an expansive population pyramid show?
It shows that younger cohorts are large relative to older cohorts, producing a broad base and a generally narrowing outline. This is commonly associated with high recent fertility and strong population momentum.
Does an expansive pyramid always mean rapid population growth?
It usually indicates strong growth potential, but the current growth rate also depends on mortality and migration. The chart should be checked against fertility, growth, and changes over time.
Is an expansive population pyramid the same as demographic transition stage 2?
No. Expansive describes a visible age structure, while stage 2 describes a simplified combination of high birth rates and falling death rates. A pyramid alone cannot establish a DTM stage.