Constrictive Population Pyramid: Meaning, Causes, and Examples
Learn how to identify a constrictive population pyramid, interpret its narrow base and older cohorts, and avoid simplistic conclusions about ageing and decline.
A constrictive population pyramid has recent child cohorts that are narrower than important adult cohorts above them. The outline may resemble an urn, an inverted pyramid, or a column pinched at the bottom. It is commonly associated with sustained low fertility and population ageing.
The correct first conclusion is limited but powerful: fewer people occupy the youngest cohorts relative to the adult generations already present. Whether the total population is already declining—and why—requires growth, mortality, and migration data.
How to recognize a constrictive pyramid
Look for a combination of signals:
- the 0–4 group is narrower than cohorts in their thirties, forties, or fifties;
- the three under-15 groups form a relatively small share;
- middle-aged and older cohorts create a wider center or upper middle;
- median age and the 65+ share are high relative to other populations;
- the old-age dependency component is becoming more important;
- over time, broad adult cohorts move upward while the base remains narrow.
The outline does not have to be symmetrical or smoothly inverted. Baby booms, wars, migration, and uneven fertility decline leave cohort-specific bulges and notches.
A measured example: Japan in 2026
Japan’s projected 2026 structure is strongly constrictive:
| Measure | Japan, 2026 |
|---|---|
| Population aged 0–14 | 11.0% |
| Population aged 15–64 | 58.8% |
| Population aged 65+ | 30.2% |
| Median age | 50.2 years |
| Total fertility rate | 1.23 births per woman |
| Annual population growth | −0.56% |
The 0–4 group represents about 3.1% of the population, while ages 50–54 represent about 8.0%. In other words, that middle-aged cohort is more than twice the size of the newest five-year cohort.
The Japan population pyramid shows how the bulge moves into older ages between 2026 and 2050.
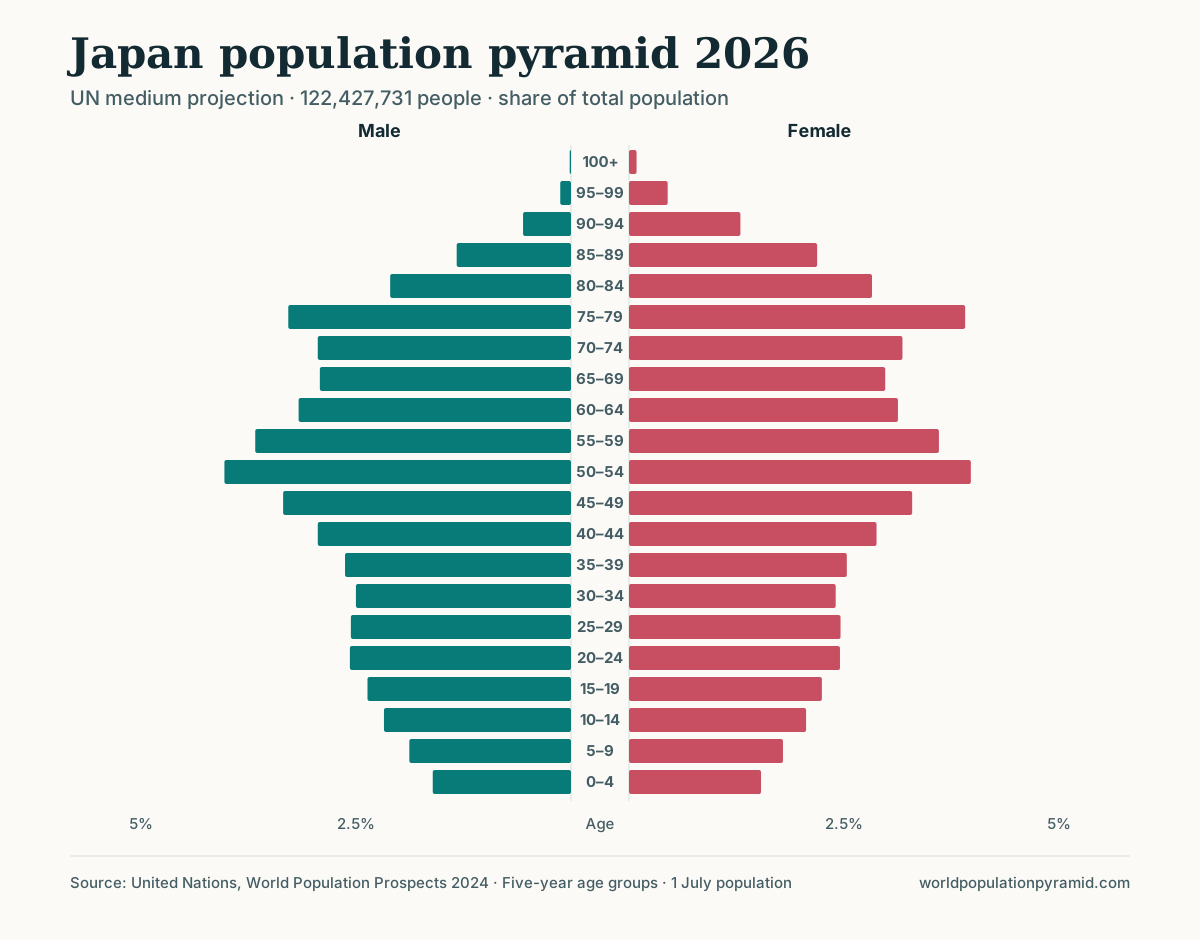
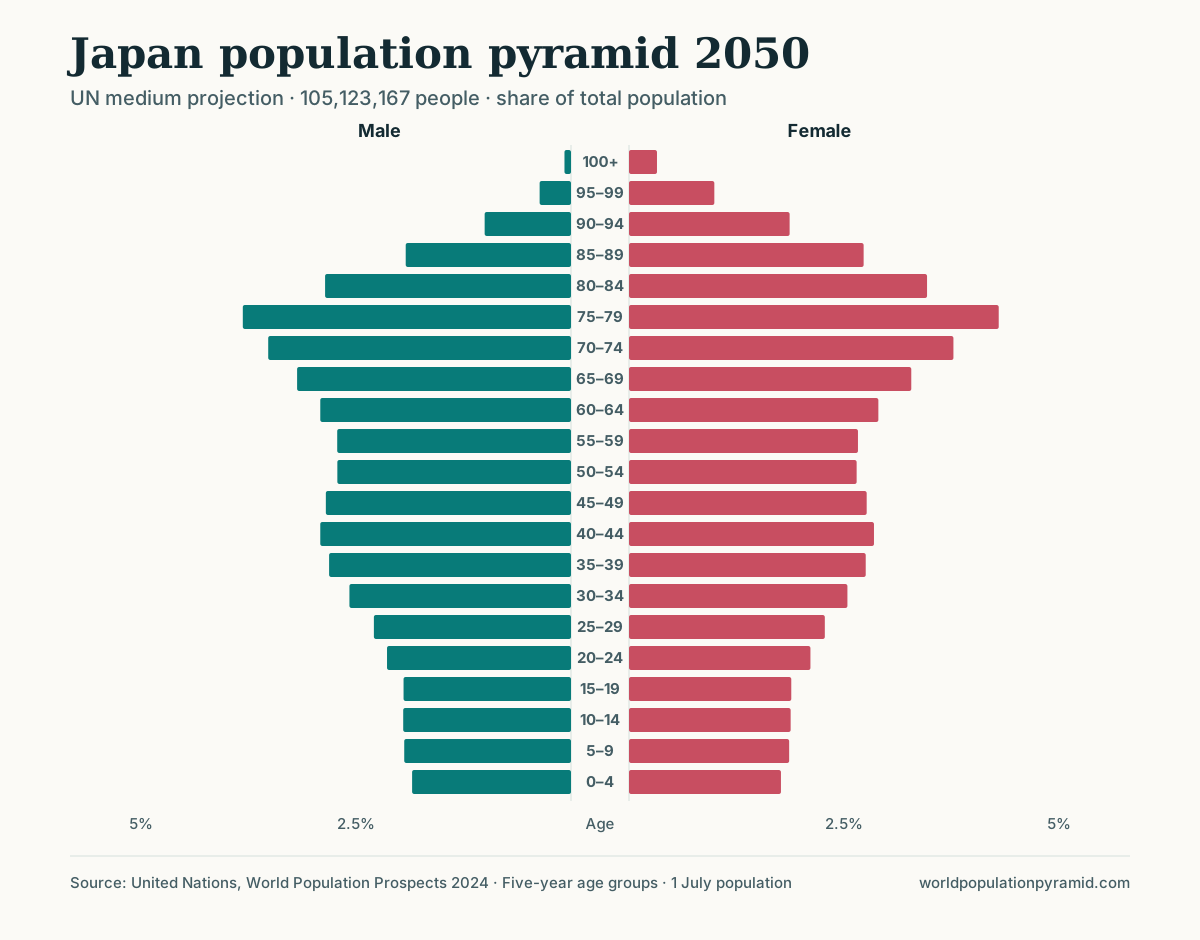
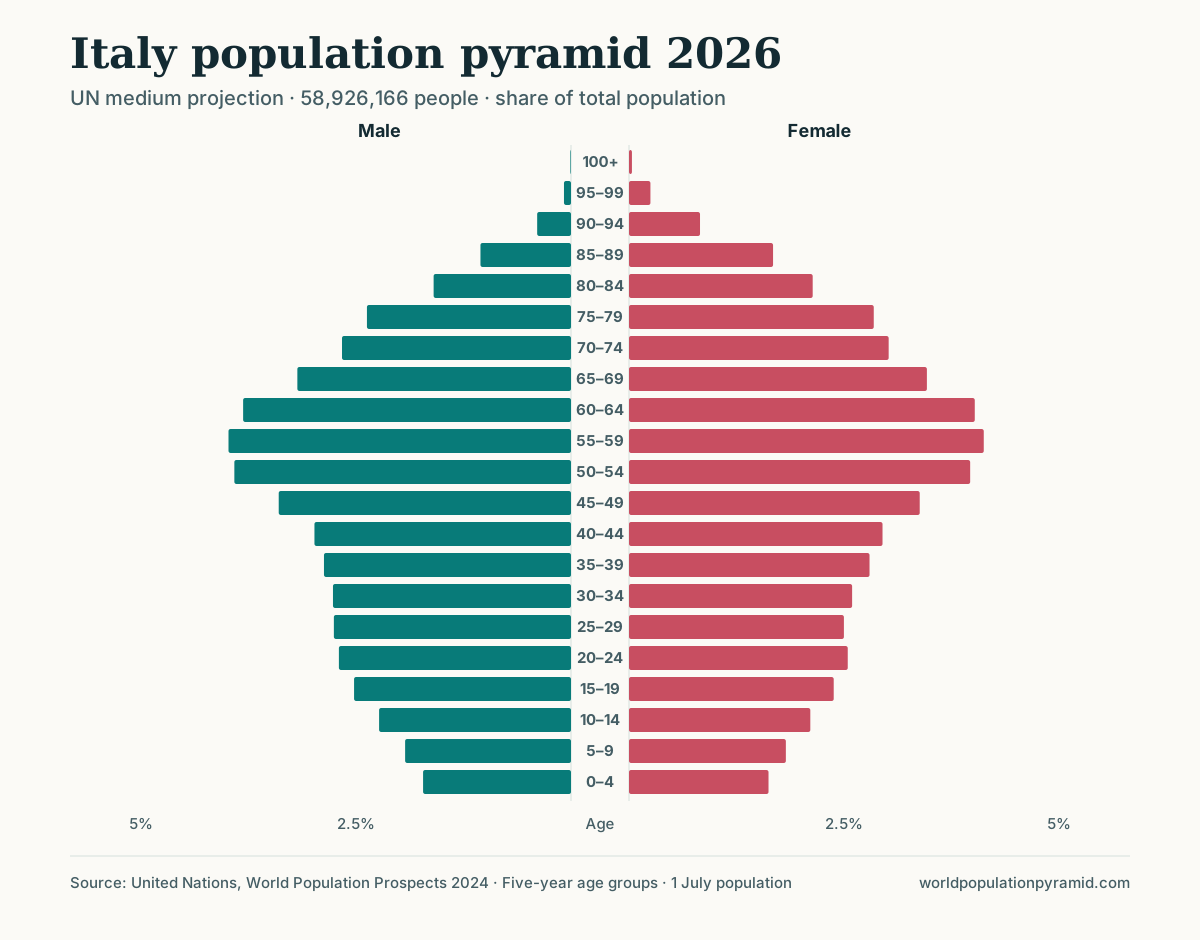
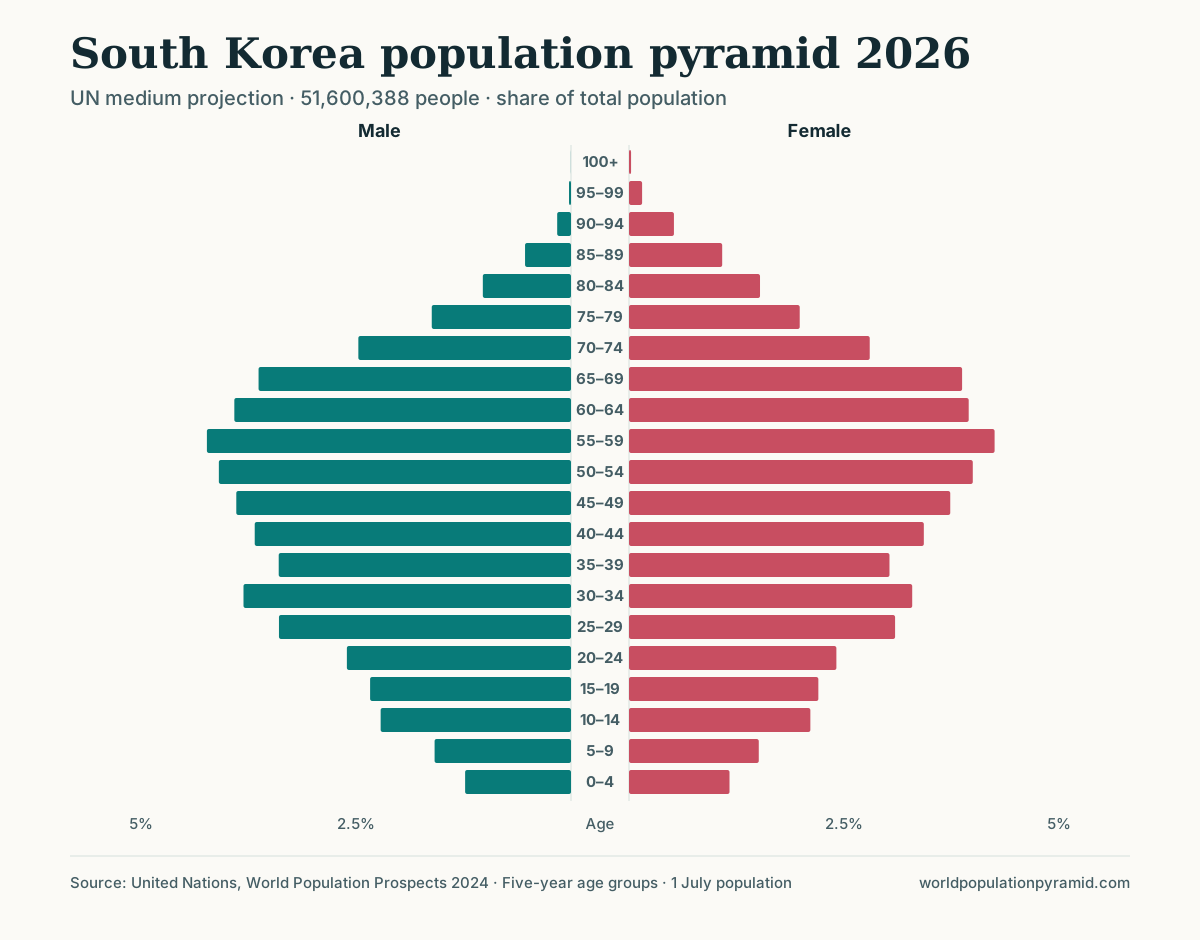
Japan is not a universal template. Italy has a similarly narrow base but a different cohort pattern, while South Korea has an even smaller under-15 share and exceptionally low current fertility. A shared label should not erase those differences.
The main demographic processes
Sustained low fertility
One year of low fertility makes one small birth cohort. Decades of low fertility create a persistently narrow base and smaller generations moving upward. This accumulated history—not merely the latest fertility rate—produces the constrictive shape.
Longer survival
Improved survival allows more people to reach older ages. Longevity broadens the upper part, but the older share also rises mechanically when younger cohorts become smaller. A large 65+ percentage can therefore reflect both success in survival and sustained low fertility.
Cohort succession
Large generations do not disappear when fertility falls; they age through the chart. A baby-boom cohort may widen the middle and later the top, producing a temporary surge in retirement ages and, later, advanced old age.
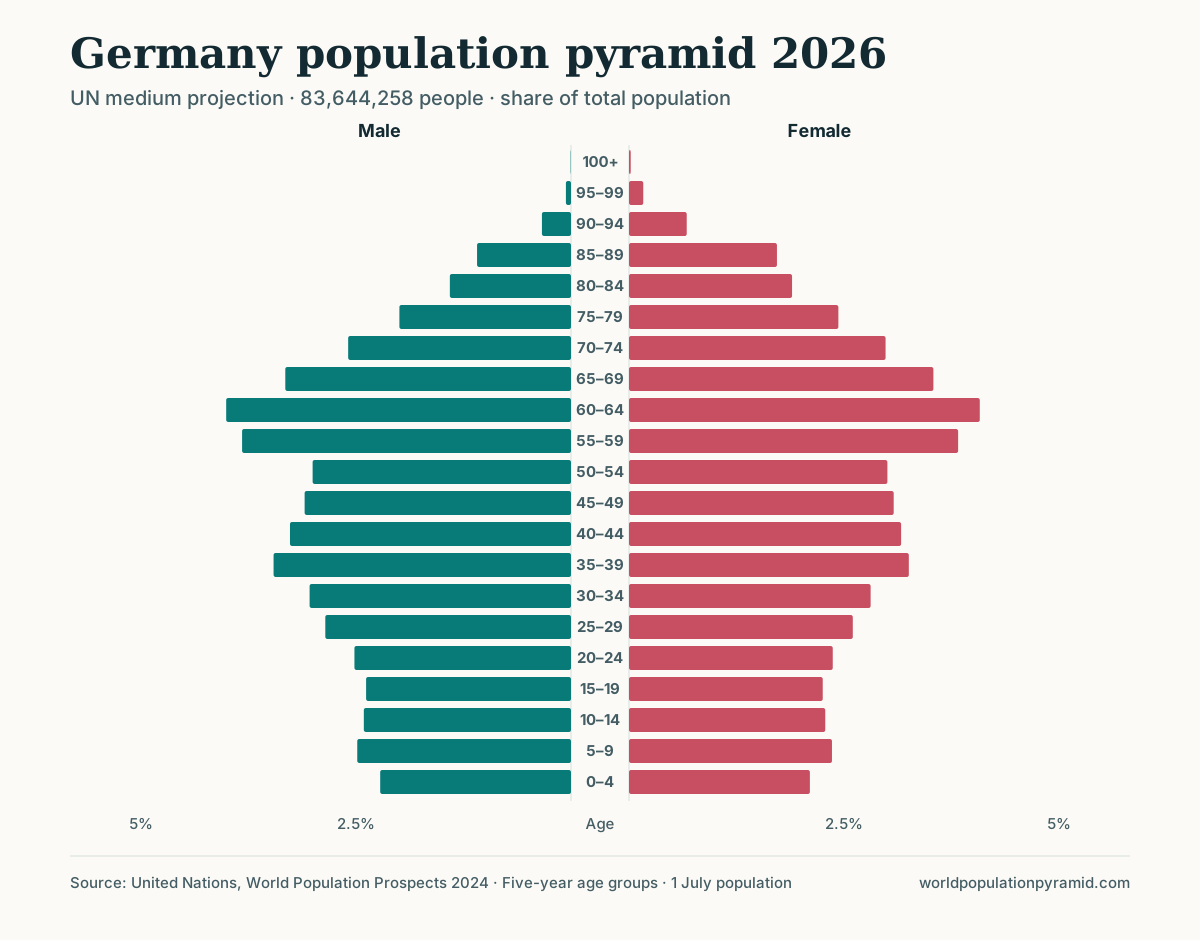
In Germany, the largest bands in 2026 are ages 55–64, the cohorts born during the high-birth years of the 1960s. They are about to cross the age-65 threshold.
Migration
Net immigration can slow total decline and add people at working and childbearing ages. Emigration can reinforce narrowing by removing young adults. Because the chart shows population stocks, it cannot separate migration from births and survival without external flow data.
Why a narrow base does not guarantee immediate decline
Population change is an accounting identity: births minus deaths plus net migration. A constrictive age structure makes natural decrease more likely as small generations enter reproductive ages and large cohorts reach ages with higher mortality, but the timing varies.
A population can remain temporarily stable or grow if:
- net immigration is sufficiently positive;
- improved survival adds years of life;
- past large cohorts still produce enough births in aggregate;
- the age structure has not yet fully adjusted to lower fertility.
For the same reason, moving fertility back to replacement level would not instantly restore a broad base or reverse ageing. Age structures change one cohort-year at a time.
Ageing is not the same as decline
These concepts overlap but answer different questions:
- Population ageing means older ages account for a growing share or the distribution shifts upward.
- Natural decrease means deaths exceed births.
- Population decline means the total falls after migration is included.
- Constrictive shape means recent cohorts are narrow relative to cohorts above them.
A population may be ageing while still growing, or declining while its older share changes slowly. Always name the measure being discussed.
Reading the male and female sides
At older ages, the female side is often wider because women experience lower mortality at many ages and therefore survive to advanced ages in greater numbers. The size of this difference varies by country and cohort.
Do not project an all-age sex ratio onto every age. A country can have roughly equal numbers of males and females overall while showing a male surplus at younger ages and a large female surplus above age 80. Conflict and sex-selective migration can create additional irregularities.
Dependency ratios: useful but limited
As older cohorts expand relative to ages 15–64, the old-age dependency ratio rises. This helps compare age balance, but it is not a count of pensioners per worker.
The conventional boundaries ignore:
- different retirement ages;
- employment below 65 and above 65;
- unemployment and study within ages 15–64;
- unpaid care and household production;
- health differences among people of the same age;
- productivity and the design of taxes, pensions, and healthcare.
Use the ratio as demographic context, not as a direct measure of fiscal sustainability.
Social and economic questions the chart raises
A constrictive structure can affect the scale and location of demand for schools, housing, healthcare, transport, and long-term care. It can change the pace of labor-force entry and the relationship between generations.
The pyramid does not determine the outcome. Adaptation depends on health at older ages, labor-force participation, productivity, migration, retirement institutions, family policy, technology, and the distribution of resources. Longer life is a social achievement as well as a planning challenge.
Avoid sensational labels such as “demographic time bomb” or “population collapse” unless the claim is tied to a clearly defined measure, time horizon, scenario, and uncertainty range.
How to compare constrictive populations properly
Use at least five measurements:
- Under-15 share: how narrow are the recent cohorts relative to the whole?
- 65+ and 80+ shares: how much ageing is already present, and at what ages? The older-population share ranking puts these figures side by side.
- Median age: where is the midpoint of the complete distribution?
- Growth and migration: is the total shrinking, stable, or growing, and why?
- Pace of change: how different are 2000, 2026, and 2050?
Then inspect cohort detail, for example by placing Japan and South Korea side by side. Japan, Italy, and South Korea may all be called constrictive, yet their largest groups, recent fertility histories, sex balance, and projected turning points differ.
A strong written interpretation
Prefer:
The 0–14 population is small relative to the large middle-aged cohorts, while the 65+ share is substantial. This is consistent with sustained low fertility and ageing. The negative growth rate shows that total decline is already projected, but migration and future fertility could change its pace.
Avoid:
The pyramid is inverted, so the country will collapse.
The first statement separates observation, measurement, interpretation, and uncertainty. The second turns a visual shorthand into an unsupported prediction.
Sources and further reading
- United Nations World Population Prospects 2024 — data used for the Japan example and projections.
- WPP 2024 Summary of Results — global ageing, peak population, and projection findings.
- WPP 2024 methodology report — assumptions and uncertainty in estimates and projections.
- U.S. Census Bureau: America’s age profile through population pyramids — cohort bulges and female predominance at older ages.
Frequently asked questions
What does a constrictive population pyramid mean?
Recent child cohorts are smaller than substantial adult cohorts, creating a narrow base. The pattern is commonly associated with sustained low fertility and population ageing.
Does a constrictive pyramid always mean population decline?
No. Total population may still grow temporarily because of momentum, longer survival, or net immigration. Growth and projection data are needed to determine direction.
Which countries have constrictive population pyramids?
Japan, Italy, and South Korea provide prominent current examples, but their exact cohort patterns, migration, median ages, and rates of decline differ.