Median Age vs Life Expectancy
Understand the difference between median age and life expectancy, with worked examples from Japan and Nigeria and advice on choosing the right measure.
Median age describes how old the people alive now are. Life expectancy describes survival under a specified set of mortality rates. Both are measured in years, but they answer different questions and cannot be substituted for one another.
What median age measures
Put everyone in a population in age order. The median divides that population into two equal halves. It is not the arithmetic mean, which adds all ages and divides by the number of people. The UN Population Division’s median-age definition uses this halfway point.
For an illustrative population with ages 5, 10, 20, 40, and 80, the median is 20, while the mean is 31. Neither calculation says when those five people will die.
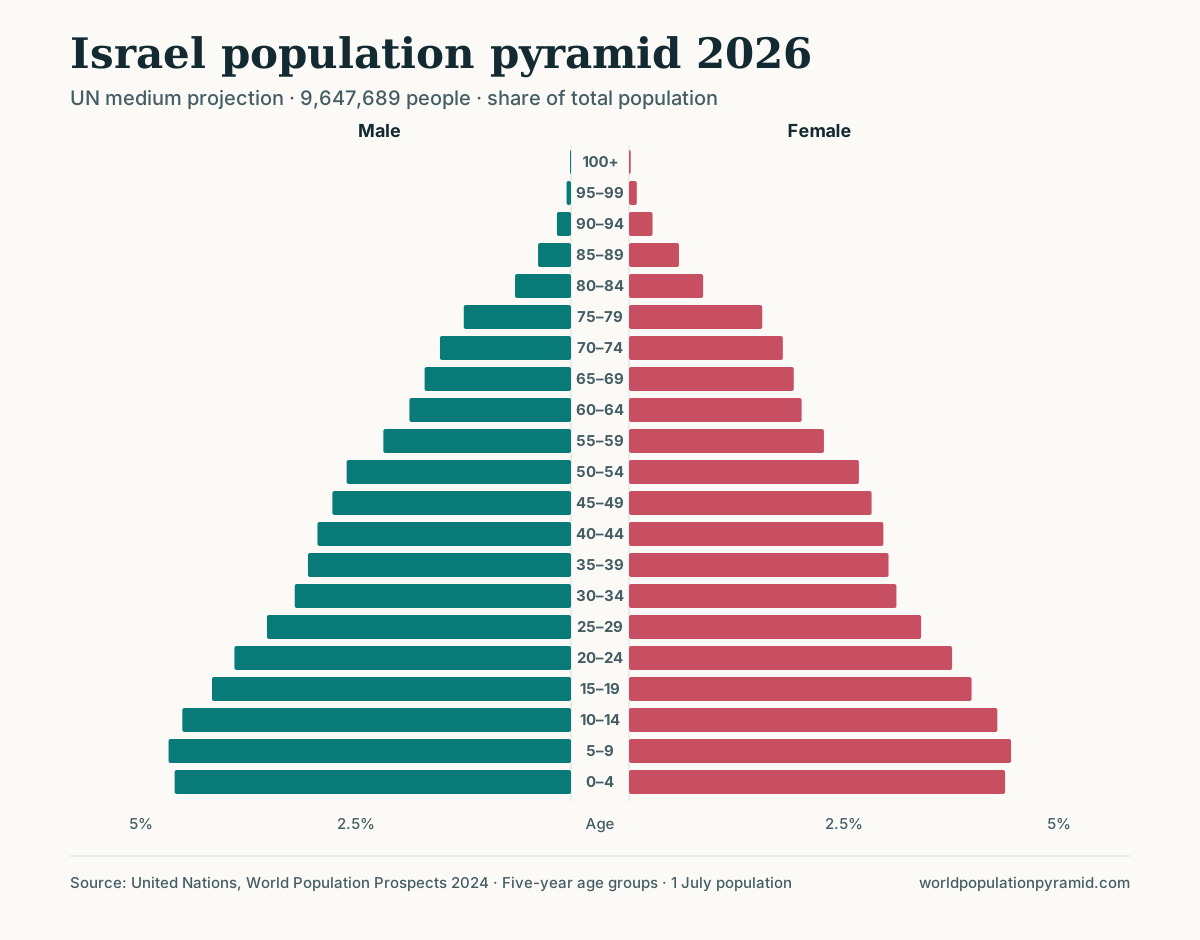
A low median can reflect many children rather than an absence of older adults. A country may therefore have both a youthful pyramid and a substantial number of people in their seventies and eighties. Israel illustrates this: in the 2026 projection its median age is 29.3 years, yet its life expectancy at birth is 82.9 years and 12.8% of its population is aged 65 or older. Fertility of about 2.7 births per woman keeps the base wide.
What life expectancy measures
Period life expectancy at birth follows a hypothetical newborn through the mortality rates for each age in a particular period. It is not a prediction of that newborn’s actual lifespan: future mortality rates may change. The WHO indicator definition explains this mortality-based measure.
Life expectancy at age 60 asks a different question: how many more years someone who has reached 60 could expect under those rates. Subtracting 60 from life expectancy at birth does not give that answer, because the person has already survived childhood and earlier adulthood.
Compare the measures without mixing them
| Measure | Question it answers | Read alongside |
|---|---|---|
| Median age | Where is the halfway point in the population’s ages? | Child share, older share, and the whole pyramid |
| Life expectancy at birth | What lifespan corresponds to this period’s mortality rates? | The period, sex, and source definition |
| Share aged 65+ | What proportion has reached this age threshold? | The number aged 65+, not only the share |
The national profiles on this site use the same UN WPP 2024 series for both median age and life expectancy. WHO is linked here for the definition; WHO values are not substituted into those profiles.
Read Japan and Nigeria as worked examples
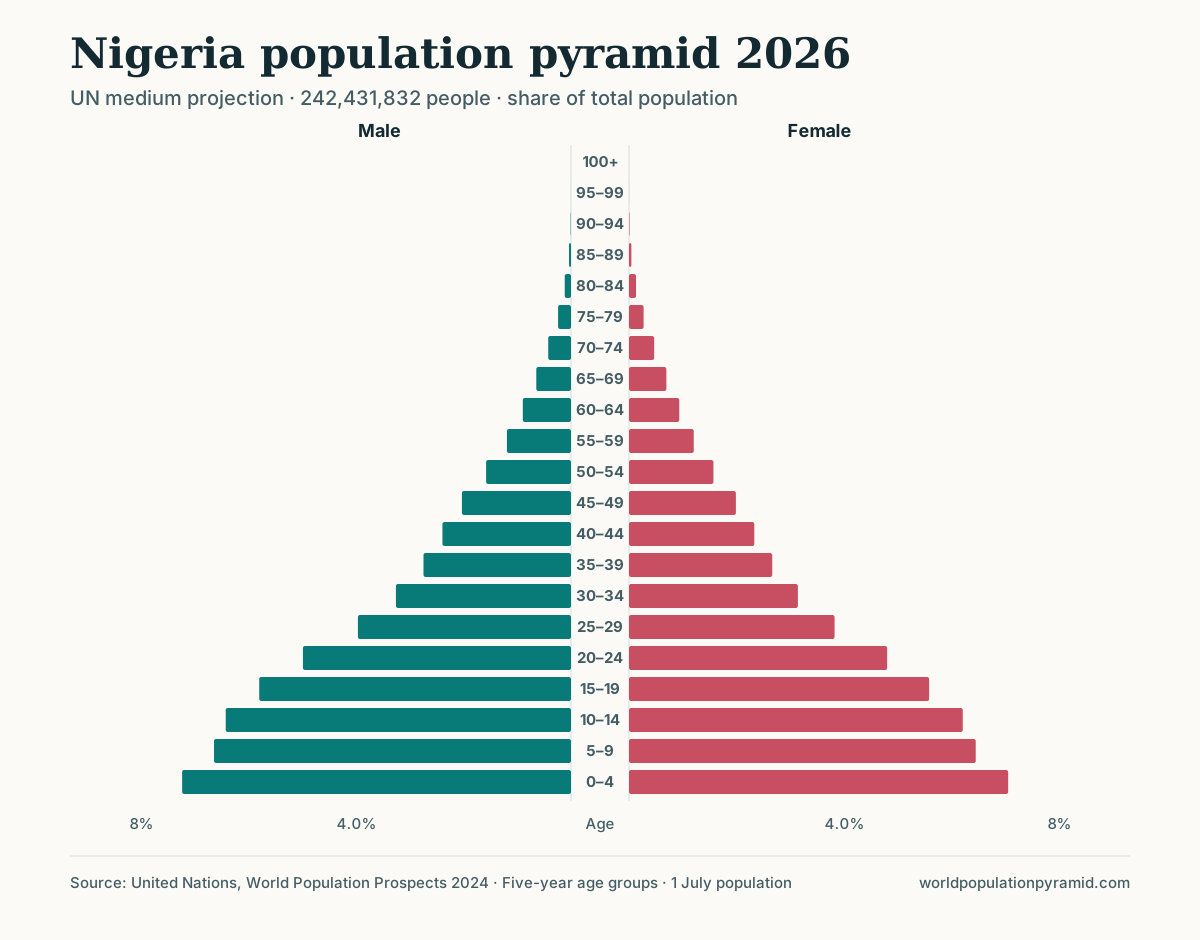
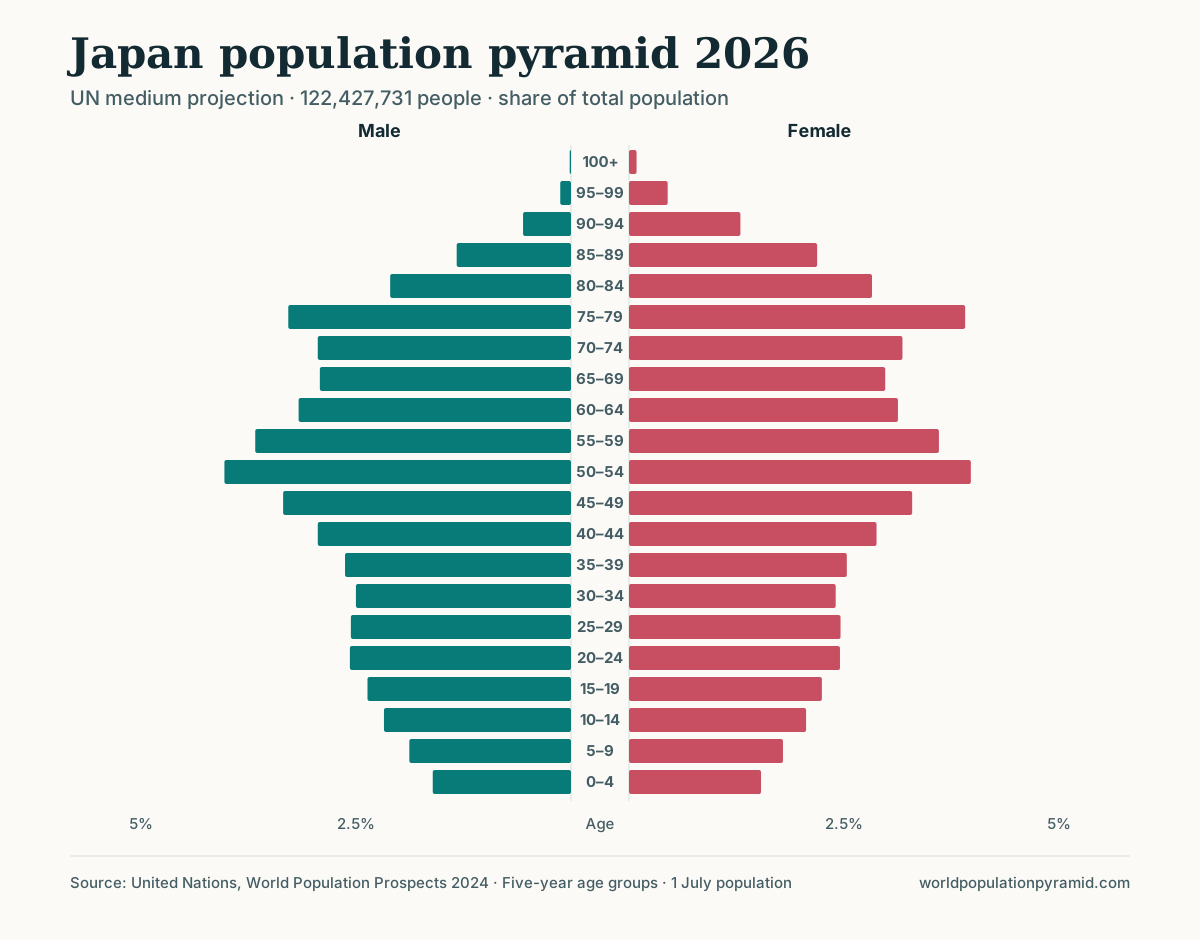
In the site’s 2026 UN medium projection, Japan has a median age of 50.2 years and life expectancy at birth of 85.1 years. Nigeria has a median age of 18.3 years and life expectancy of 55.0 years. These are values from WPP 2024, not exact counts or a later national release.
Japan’s median identifies a much older age distribution. Its life expectancy is a separate mortality indicator. Nigeria’s median does not mean a typical life ends at 18: it identifies the middle of a population with large young cohorts. Open the two charts together to see the age composition behind that distinction.
To see where other countries fall, compare the median age ranking with the life expectancy ranking.
Which measure should you use?
For a question about the balance between children and older adults, start with age shares and median age. For a question about survival, start with life expectancy and its definition. For school places or care capacity, use the relevant age-group counts: neither a national median nor life expectancy tells you how many people need a service.
When comparing years, keep the source revision and population coverage consistent. On this site, 2023 is the last historical estimate and 2024 onward is projected. A 2050 median and a 2050 life expectancy both depend on the UN medium scenario; they describe different parts of that same scenario.
Sources and calculations
- UN World Population Prospects 2024: source of the country values above.
- Site methodology: source revision, units, rounding, and the estimate/projection boundary.
- Population ageing explained: how changing cohort sizes affect the age distribution.
Frequently asked questions
Does a median age of 20 mean most people die young?
No. It means half the population is younger than 20 and half is older. Large recent birth cohorts can produce a low median age even when many people survive to older ages.
Can I subtract my age from life expectancy at birth?
No. Remaining life expectancy must be calculated conditional on survival to your current age. Life expectancy at birth includes mortality risks at ages you have already survived.
Can median age rise without life expectancy rising?
Yes. Smaller birth cohorts can increase the relative weight of adults and older people even if mortality rates do not improve.