Population Pyramids: Counts vs Percentages
Calculate population pyramid shares, compare countries on the same scale, and distinguish a percentage-point change from a change in population counts.
A population pyramid drawn in counts shows how many people occupy each age and sex group. A pyramid drawn in percentages shows how that group fits into the population as a whole. Use counts to measure scale and percentages to compare composition.
Calculate the share behind a bar
The charts on this site divide each male or female age-group count by the total population across all age groups and both sexes:
Bar share = age-and-sex group count ÷ total population × 100.
Suppose an illustrative population has 1,000,000 people, including 40,000 males and 38,000 females aged 0–4. The left bar is 4.0% and the right bar is 3.8%. Together, ages 0–4 account for 78,000 people, or 7.8% of the population.
That left bar is not the percentage of males who are aged 0–4. Such a calculation would need the total male population as its denominator. Always check which denominator a chart uses before comparing it with another publisher’s chart.
A larger share can mean fewer people
Consider two hypothetical countries:
| Country | Total population | Under-15 share | People under 15 |
|---|---|---|---|
| A | 10 million | 30% | 3 million |
| B | 100 million | 20% | 20 million |
Country A has the more youthful composition by this measure. Country B has more than six times as many children. A wider percentage bar therefore does not establish a larger absolute population.
The same pattern appears in real data. In the 2026 projection, about 45.8% of Niger’s population is under 15, compared with 40.0% in Nigeria. But Niger’s share applies to about 28.8 million people and Nigeria’s to about 242.4 million, so Nigeria has roughly 97.0 million children under 15 against Niger’s 13.2 million.
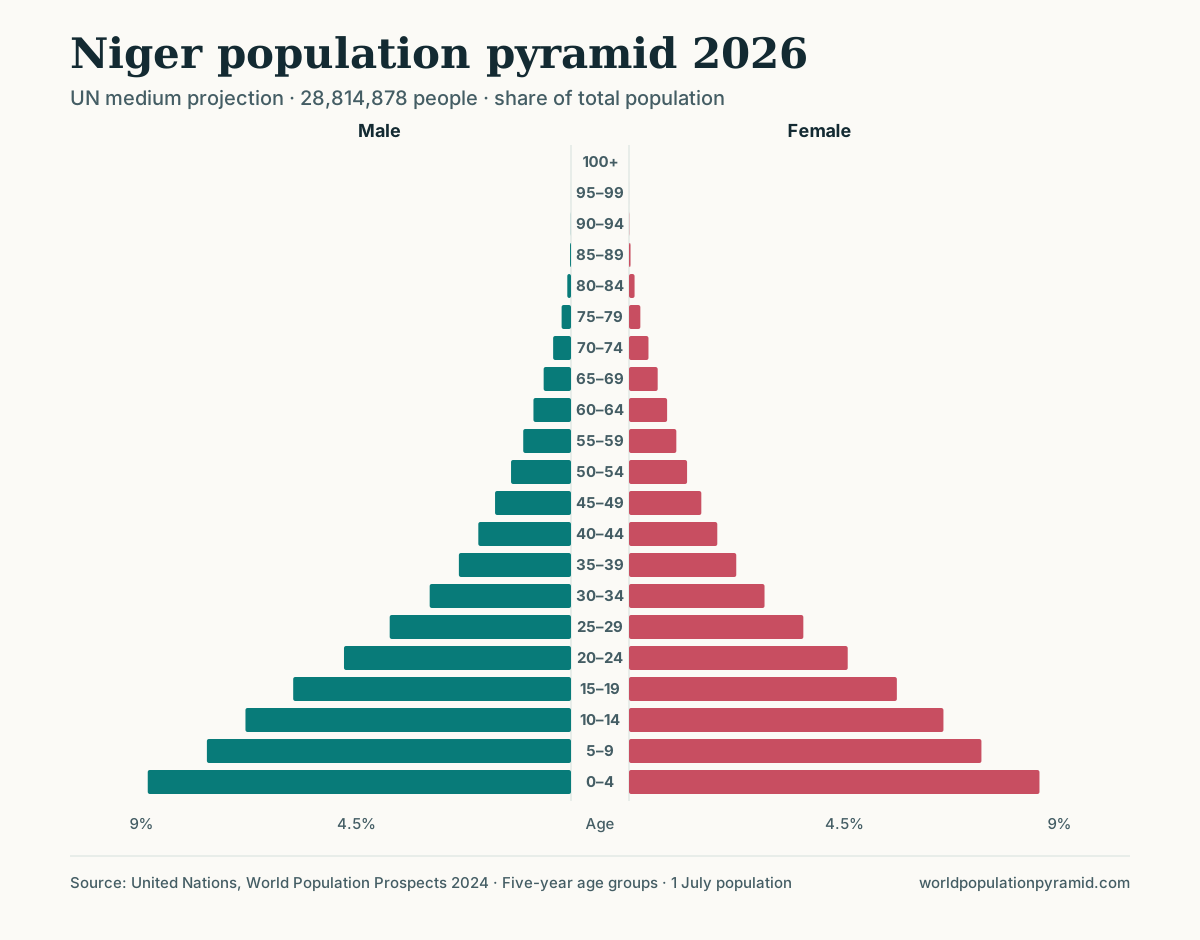
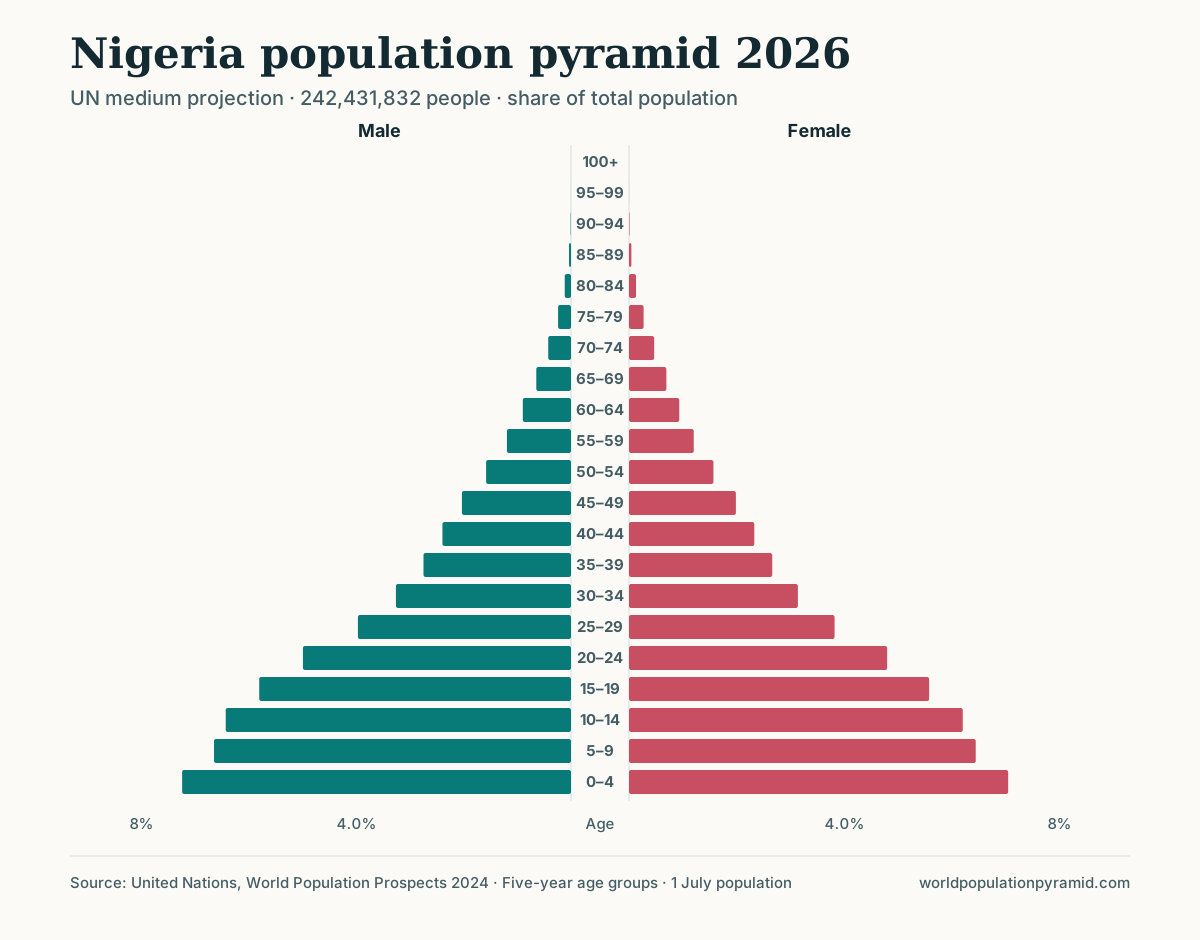
This distinction matters when reading a child-share ranking. That table ranks composition. For the number of children in a particular country, use its age table or the age-group calculator with ages 0–14.
Check whether the scales match
On a country profile, the percentage axis stays fixed as you switch chart years. The scale is chosen to accommodate the profile’s available age distributions. Separate country profiles can have different axis limits, so equal-looking bar widths are not always equal shares.
The comparison page uses a shared percentage scale for both countries. This is the appropriate view for comparing bar widths directly. Read the population totals beneath the charts as well if absolute size matters.
The charts show five-year bands, except for the open-ended 100+ group. That final bar combines everyone aged 100 or older; it is not another exactly five-year cohort.
Percentage points are different from percent change
Imagine an older-population share increasing from 10% to 15%. The increase is 5 percentage points. Relative to the original 10% share, it is a 50% increase: (15 − 10) ÷ 10 × 100.
Now suppose the total population also rises from 1 million to 1.2 million. The older population grows from 100,000 to 180,000—an 80% increase in people. All three statements describe the same example, but they measure different changes.
A falling share can also coexist with a rising count. If a population grows from 1 million to 2 million while its child share falls from 30% to 20%, the number of children rises from 300,000 to 400,000.
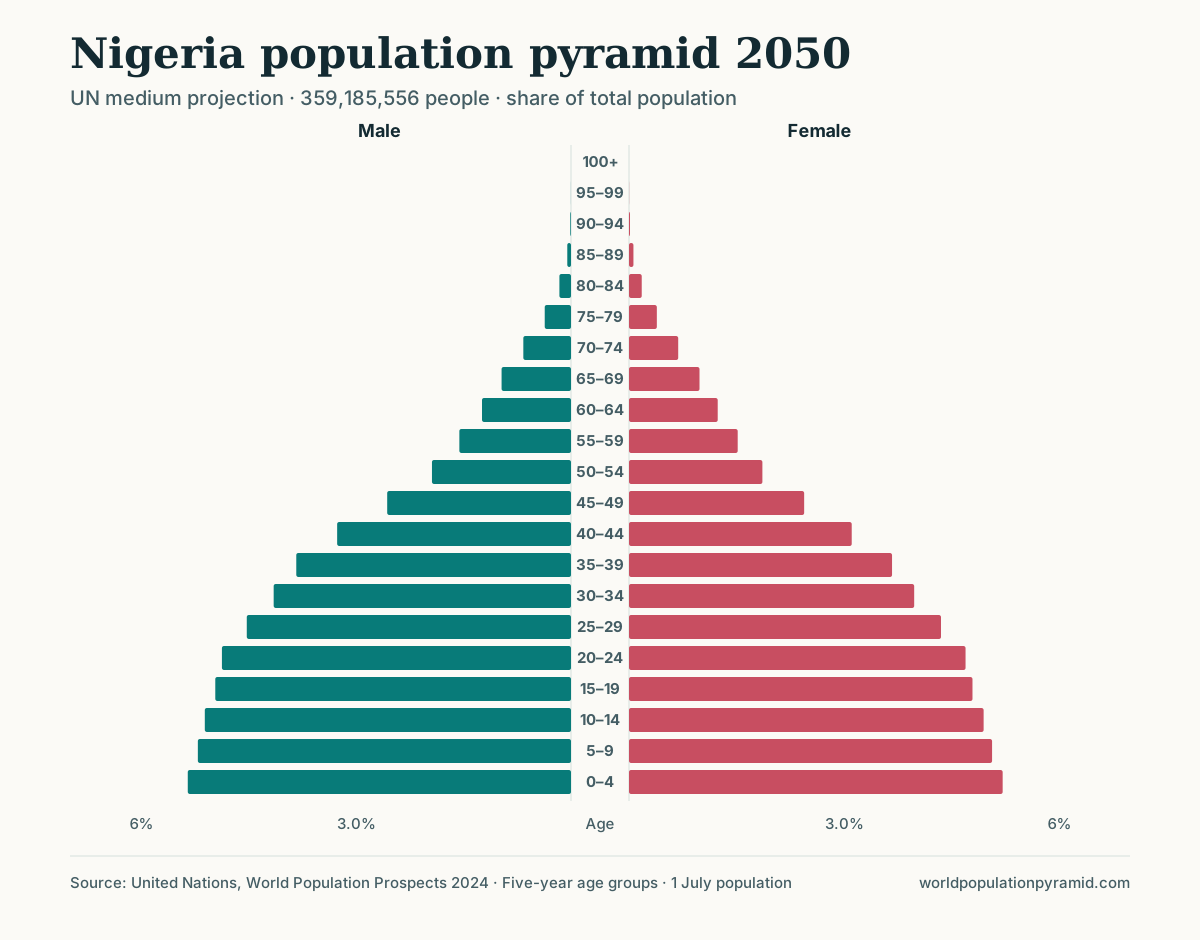
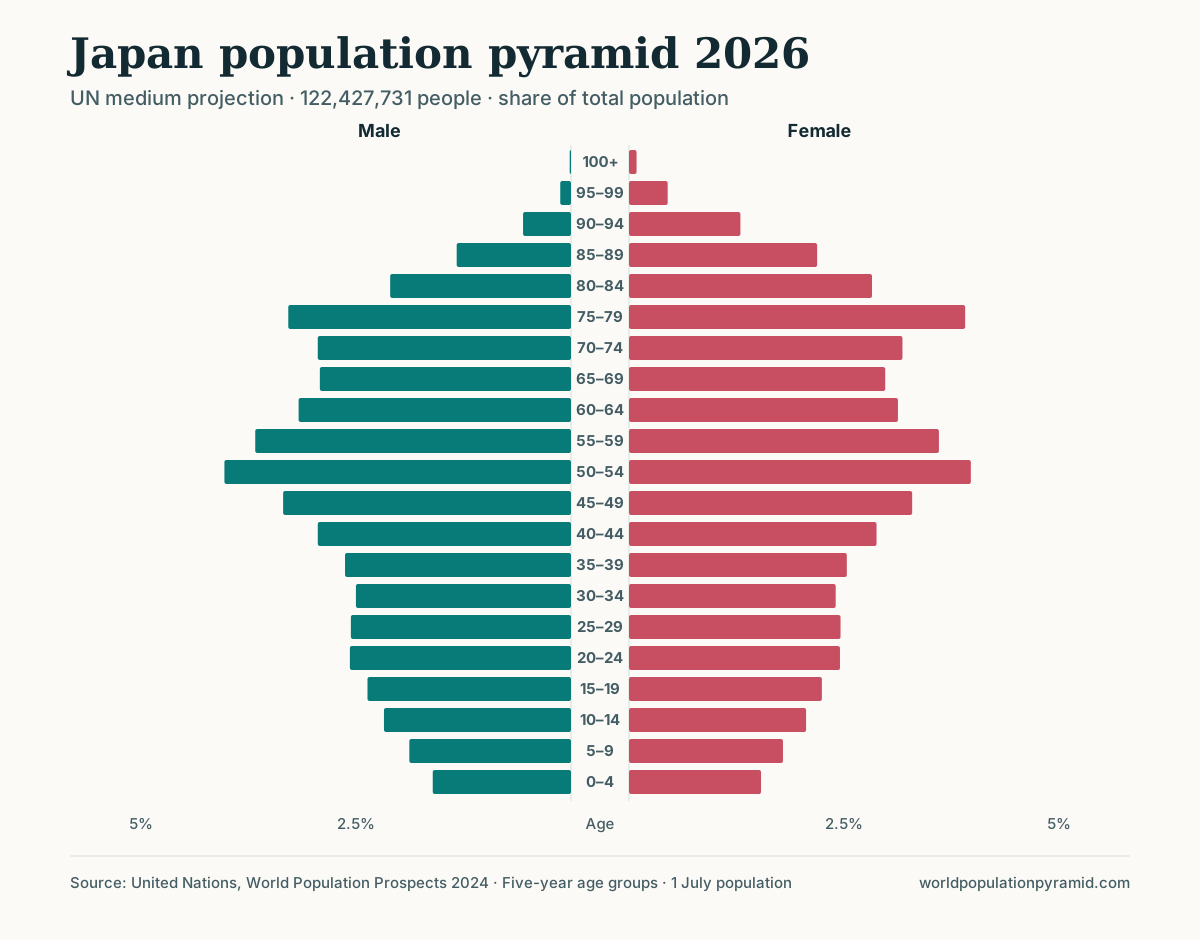
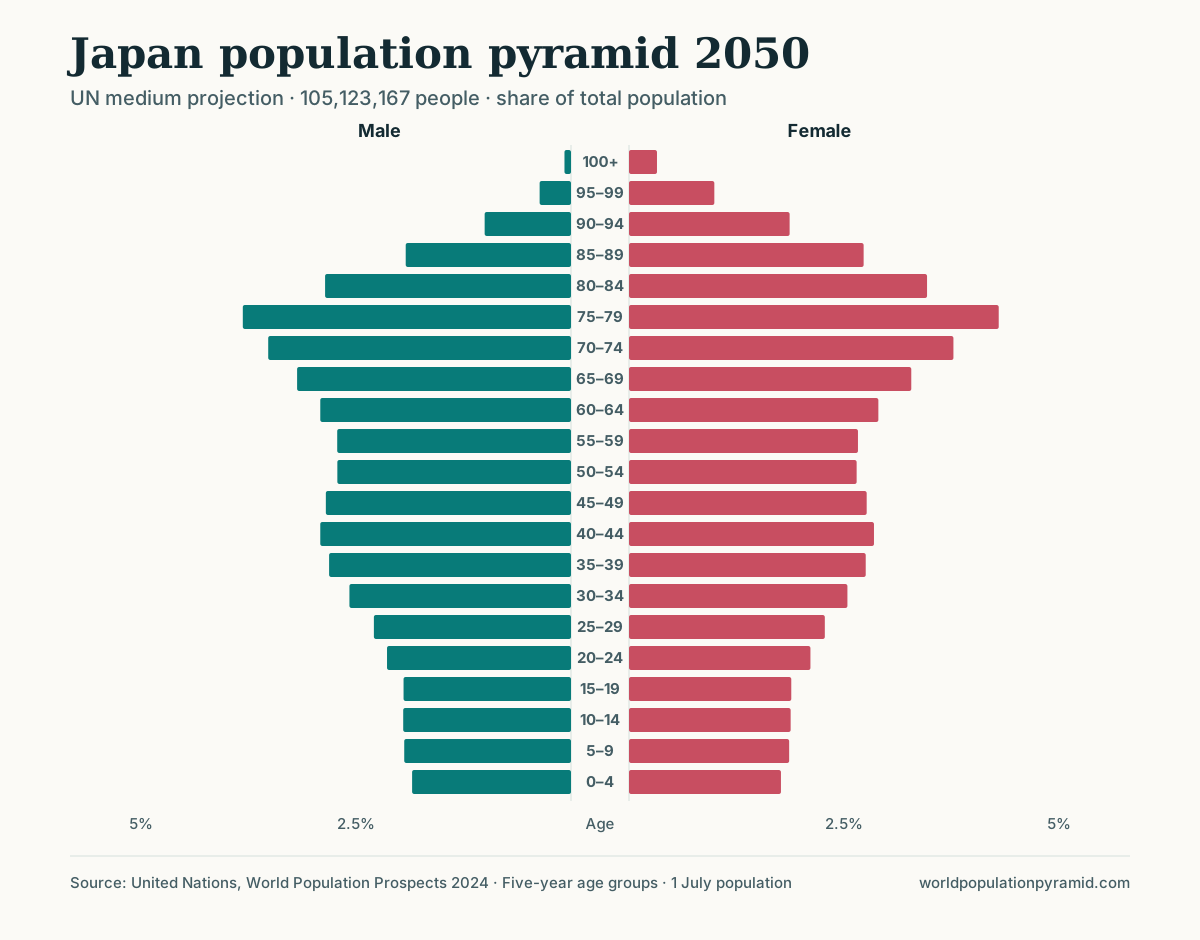
Both effects appear in the UN projections. Nigeria’s child share falls by about 9.1 percentage points between 2026 and 2050, from 40.0% to 30.9%, yet the number of children rises from about 97.0 million to 111.0 million. In Japan, the 65+ share rises by about 7.3 percentage points, from 30.2% to 37.5%, a relative increase of about 24%; the number of people aged 65 or older rises by only about 7%, from 37.0 million to 39.4 million, because the total population shrinks.
Keep the year attached to the number
Switching a country’s chart to 2050 changes the pyramid, but the country page’s explicitly labeled 2026 age table and headline indicators remain a 2026 reference. For exact values in another year, use the CSV download or choose that year in the calculator.
Preserve the year, age boundaries, units, and data status when copying a result. Values through 2023 are historical estimates; later years are the UN WPP 2024 medium projection. Rounding can make displayed shares sum slightly above or below 100%.
Sources and method
The numerical examples in this guide are hypothetical and calculated with the formulas shown. Country charts use UN World Population Prospects 2024. The site methodology documents conversions, age boundaries, rounding, and projections; the chart-reading guide explains how to interpret the shape.
Frequently asked questions
Do both sides of a percentage population pyramid add to 100%?
On this site, yes. Each bar is a share of the whole population, so all male and female age groups together sum to approximately 100%, allowing for displayed rounding.
Can a country have a smaller child share but more children?
Yes. Share depends on the total population. A smaller percentage of a much larger population can represent more people.
Does a rise from 10% to 15% mean a 5% increase?
It is a rise of 5 percentage points, or a 50% relative increase in the share. The change in the number of people also depends on the population total.