Baby Booms and Echo Cohorts: Reading Bulges and Notches in a Pyramid
Learn how baby booms, birth deficits, and their echoes create bulges and notches in a population pyramid, how to date them, and how to use the Distinctive cohorts table.
A population pyramid is a record of birth history. Every five-year band is a group of people born in the same five years, reduced by deaths and changed by migration since then. When births surge or collapse, the pyramid keeps a lasting mark: a bulge where a cohort is larger than those on either side, or a notch where it is smaller.
These marks move up the chart by five years every five years. Many also produce an echo about one generation later, when the large or small cohort reaches the main childbearing ages.
Birth-year arithmetic
Dating a cohort only takes subtraction: birth years ≈ chart year − age. A band aged 50–54 in 2026 was born from about 1972 to 1976. Because ages and dates rarely align exactly, the result is approximate to about a year at either end.
The same arithmetic works in reverse. A cohort born in 1987–1991 will be aged 35–39 in 2026 and 59–63 in 2050. Many of the key years shown on this site are multiples of 25 years apart (1950, 1975, 2000, 2050, 2075, 2100), so between 1950 and 1975, for example, a cohort moves exactly five bands.
Booms and their echoes
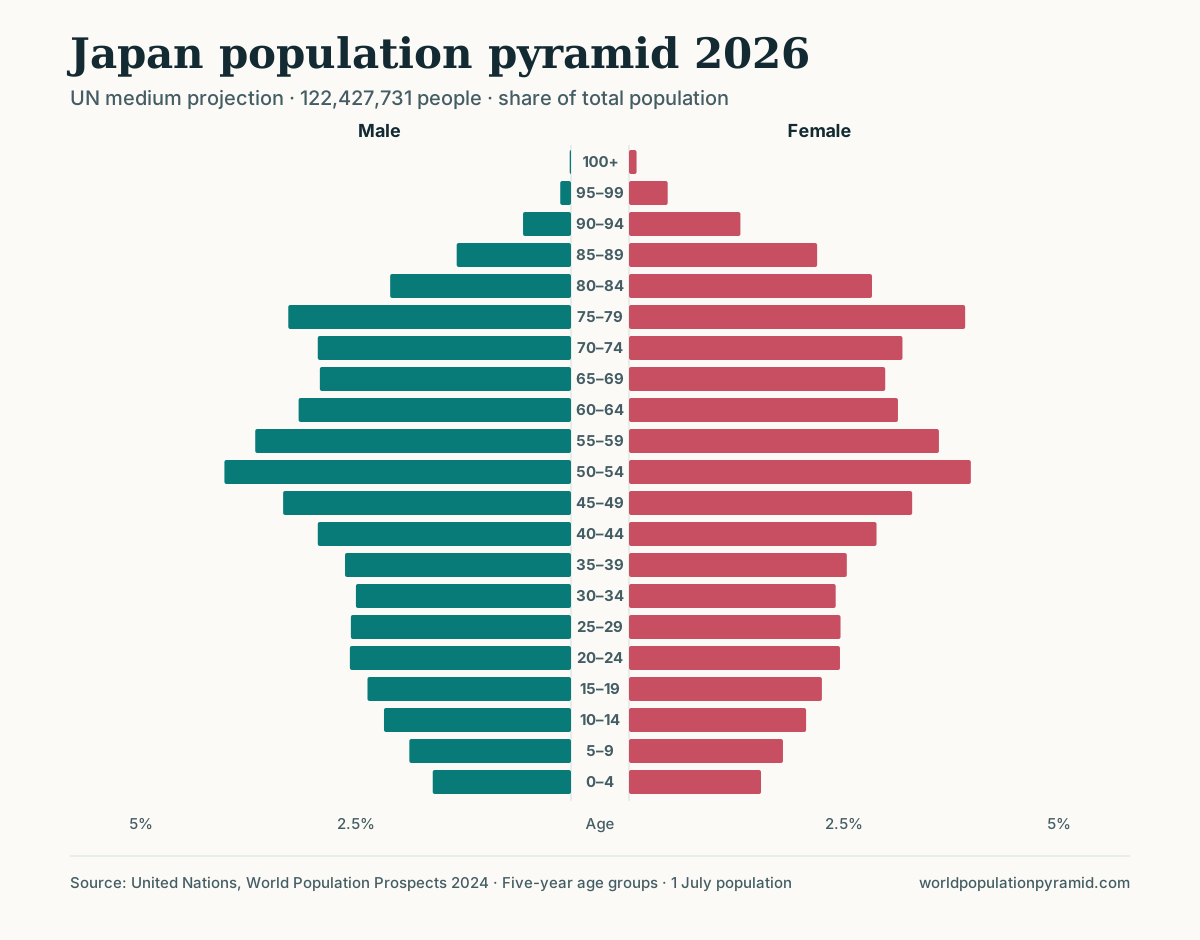
Japan has two of the clearest bulges among large countries. In the 2026 projection, the 75–79 band, born about 1947–1951, is 30% larger than the average of its neighbours: this is the postwar baby boom. The 50–54 band, born about 1972–1976, is 15% larger: this is the boom generation’s children.
The two bulges are 25 years apart, roughly the age at which much of the boom generation had its children. The echo is smaller than the original because the boom cohort had fewer children per person than its parents: Japan’s total fertility rate fell from 3.62 in 1950 to 2.04 in 1970. A third echo around the late 1990s would have required the 1970s cohort to have many children; it did not, and the base has narrowed instead.
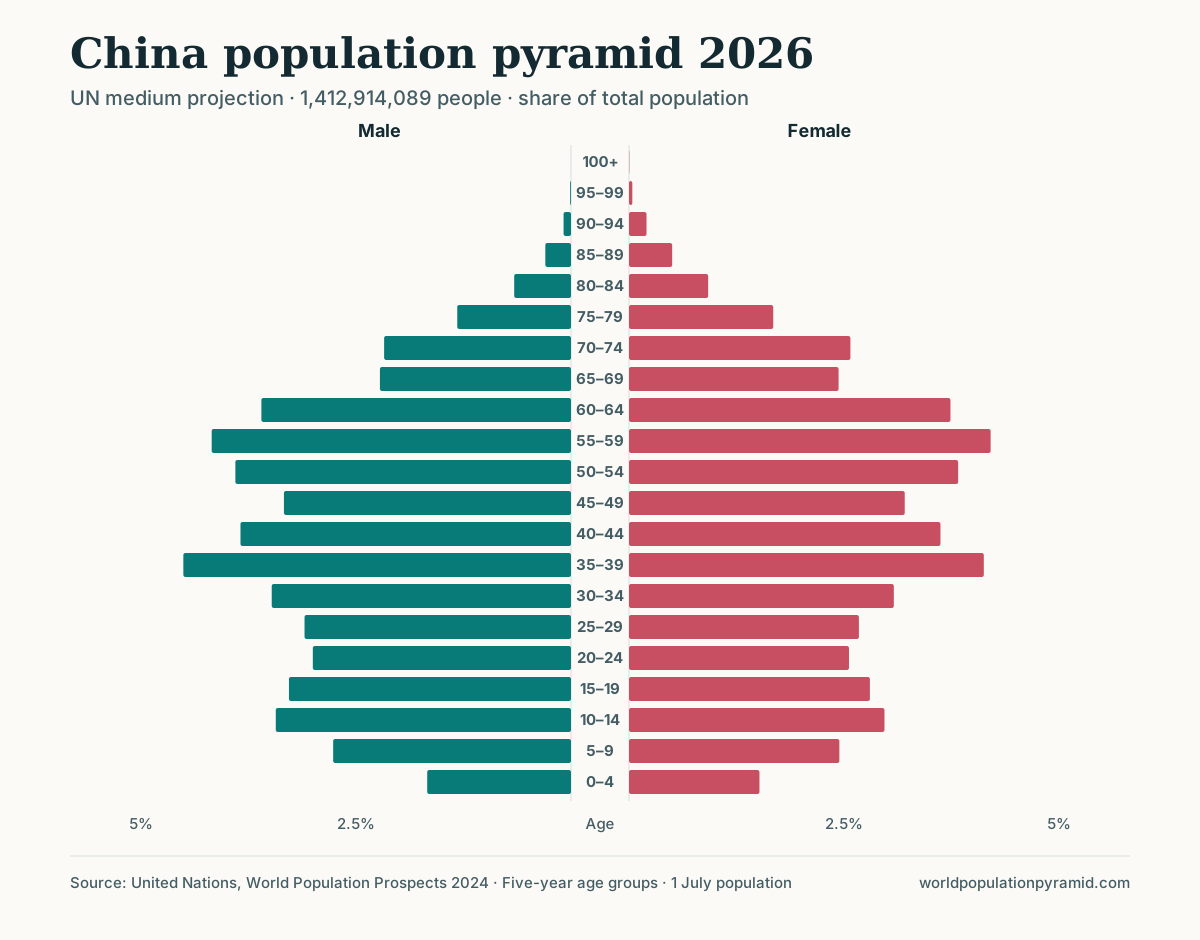
China shows a longer chain. Its 2026 bulges at 55–59 (born about 1967–1971), 35–39 (1987–1991) and 10–14 (2012–2016) are each roughly a generation apart, and each later bulge is partly the children of the earlier one. The spacing shortens or lengthens as the age at childbearing changes, so echoes are never perfectly regular.
Deficits: war, famine, and calendar effects
Notches record crises. Some mark a fall in births; others mark excess deaths among young people; many combine both.
Russia: a war deficit and its echoes
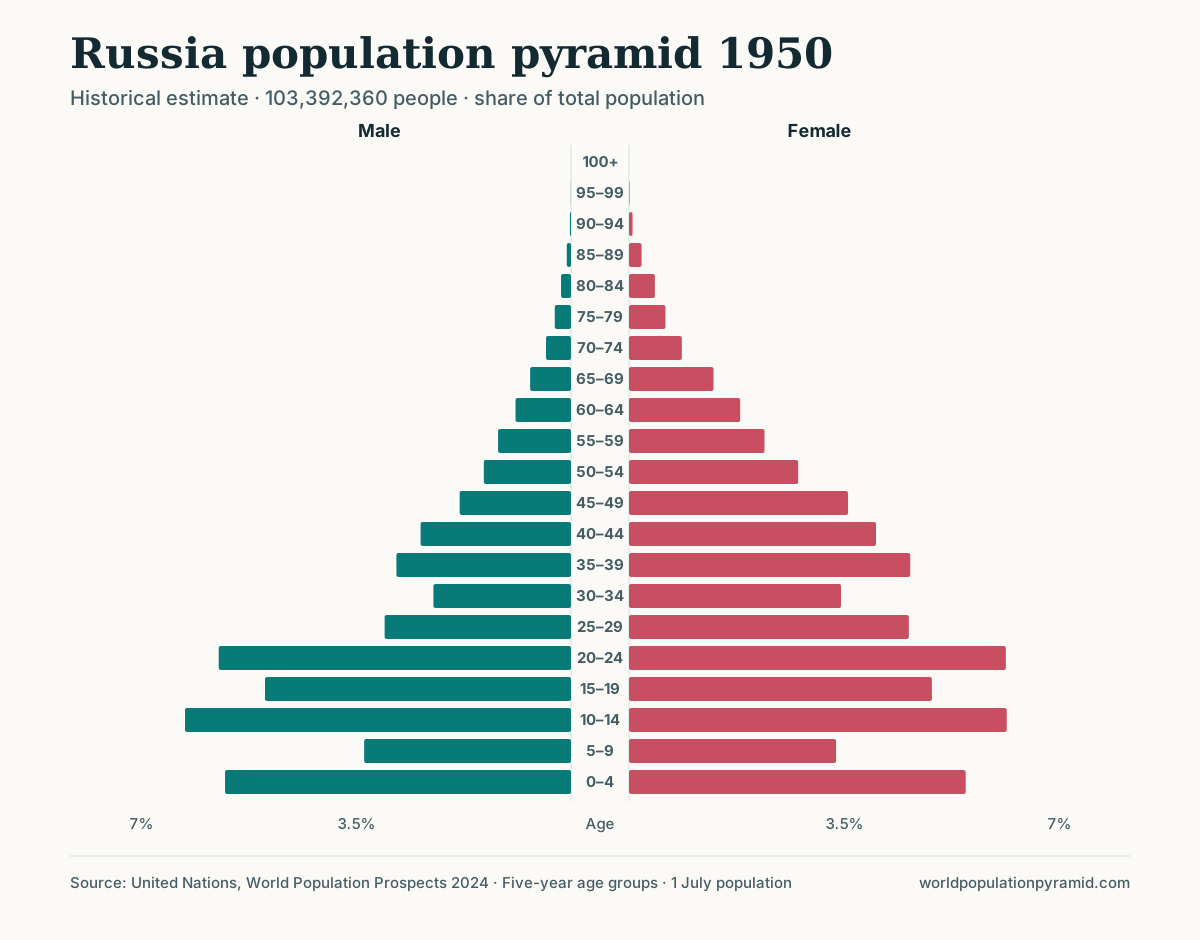
Russia carries one of the deepest scars among large populations. In the 1950 estimates, the 5–9 band, born during the Second World War, held about 7.0 million people, against 12.9 million at ages 10–14 and 11.5 million at 0–4. The cohort was roughly 46% smaller than the one born just before the war.
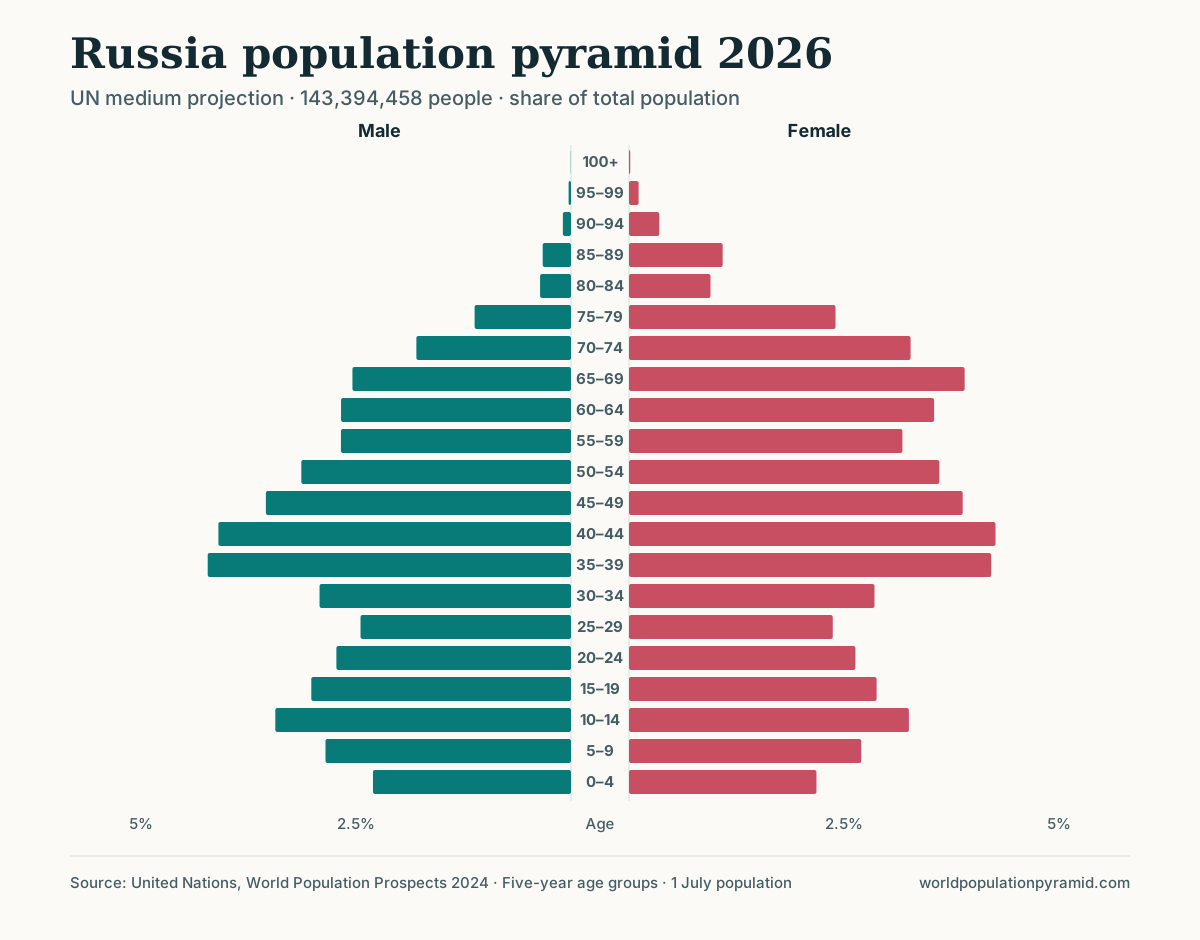
The scar is still visible 76 years later: in 2026 the 80–84 band (about 1.9 million) is smaller than the older 85–89 band (about 2.0 million), even though mortality normally makes each older band narrower. Its echo appears as a notch at 55–59 in 2026, about 10% smaller than its neighbours, and a second-generation echo at 25–29 (born about 1997–2001) is 13.5% smaller. That later notch also coincides with Russia’s very low fertility around 2000, when the total fertility rate was 1.19, so it is an echo amplified by a separate decline. Between them, the 35–39 band, born in 1987–1991, is a bulge 19% larger than its neighbours.
The Russia and Ukraine comparison places this pyramid beside a neighbour with a related twentieth-century history.
China 1959–1961: famine
China’s 2026 pyramid has a notch at 65–69, born about 1957–1961, 23% smaller than its neighbours. Those birth years include the famine of 1959–1961. UN estimates record the fertility collapse: the total fertility rate was 5.81 in 1950, 4.45 in 1960 and 6.08 in 1970, and 1960 is the first year in the series in which deaths exceeded births. The 70–74 band just above it, born before the famine, is a bulge 24% larger than its neighbours.
Japan 1966: a one-year dip
Japan’s 1966 birth deficit had a cultural cause. 1966 was a hinoeuma (fire horse) year, linked to a superstition about girls born in that year, and Japan’s vital statistics recorded a sharp one-year fall in births followed by a rebound in 1967. The dip is real, but in 2026 the 1966 cohort is split between the 55–59 and 60–64 bands and averaged with normal years. Neither band is flagged. Single-year events are generally invisible in five-year pyramids.
How to read the “Distinctive cohorts” table
Each country page includes a table titled “Distinctive cohorts and turning points”. It compares every five-year band under age 80 in 2026 with the average of the two bands on either side. A band is listed as a bulge if it is larger than both neighbours and at least 10% above their average, and as a notch if it is smaller than both and at least 10% below. The “born about” column applies the arithmetic above.
A repeatable method:
- Start with the table. Note each feature, its sign, and its birth years.
- Look for pairs about one generation apart. The mother’s mean age at birth, listed under life expectancy and mortality, gives the current spacing; past spacing was often a few years shorter.
- Trace each feature with the pyramid slider. Move to 2000 and 1975 and confirm the band is the same cohort at a younger age. Use the outline overlay to compare two years on one chart.
- Check the trend table. A boom should show up as high births and fertility in the decade concerned; a crisis as a fall in births or a rise in deaths.
- Rule out migration. If the feature appears only in adulthood or mainly on one side, read how migration shapes population pyramids.
- Measure precisely. The age-group calculator gives exact counts for any band so the size of a cohort can be compared across years.
Limits of the table
The method is simple, and its blind spots follow from that.
- Broad booms can be missed. The United States has no flagged cohorts in 2026, although its baby boom of 1946–1964 is one of the best known. A boom lasting 19 years spans four to five bands, now aged about 62–80, and the 10% test compares each band with neighbours that belong to the same boom.
- Ages 80 and above are excluded. At these ages mortality dominates differences between bands, so Russia’s war cohort at 80–84 is not listed even though it is visible.
- One-year events are diluted, as the Japan 1966 example shows.
- The cause is not identified. A bulge can be a birth surge, an arrival cohort of migrants, or a cohort that escaped a mortality crisis. The table says “born about” for every feature, even when many members were born abroad.
- Estimates smooth the data. UN estimates for countries with limited registration are built from models and surveys, which can soften or even create irregularities.
Why cohort features matter
Bulges and notches change demand as they age: school places, entry-level jobs, housing, and later pensions and care. A notch entering its twenties means fewer potential parents and fewer births a few years later, which is one reason population momentum can be negative. A large cohort crossing 65 produces a step increase in the older population, discussed in population ageing explained.
Sources
- United Nations World Population Prospects 2024
- WPP 2024 methodology report
- U.S. Census Bureau: By 2030, all baby boomers will be age 65 or older
- ISVD: Hinoeuma 2026 — superstition vs structural decline
- Akabayashi (2008), “Lives of the Firehorse Cohort: What the Statistics Show”, The Japanese Political Economy
Frequently asked questions
What is an echo cohort?
An echo cohort is a smaller bulge or notch that appears about one generation after an unusually large or small birth cohort, because that cohort later has more or fewer children of its own.
How do you work out when a cohort was born?
Subtract its age from the year of the chart. People aged 75–79 in 2026 were born between about 1947 and 1951.
Why does Japan's 1966 birth dip not show clearly in the pyramid?
The dip lasted a single year. In five-year age bands it is averaged with four normal years, so it barely changes the width of its band.
Does every baby boom appear in the Distinctive cohorts table?
No. The table flags bands under age 80 that are at least 10% larger or smaller than both neighbours. A boom that lasts many years, such as the United States boom of 1946–1964, spans several bands and may not stand out against its immediate neighbours.