How Migration Shapes Population Pyramids
Learn how immigration, emigration, refugee flows, and return migration reshape a population pyramid, and how to tell a migration effect from a birth effect.
Migration is the only one of the three demographic components that can add people at ages above zero. Births enter at age zero and deaths are concentrated at the oldest and, in high-mortality settings, the youngest ages. Migrants, by contrast, arrive and leave mostly as young adults, so migration reshapes the middle of the pyramid.
The pattern is strong enough to read. A country that receives many labour migrants develops a wide waist, often on the male side only. A country that loses many young adults develops a pinch in the same place. With the migration figures and charts on each country page, it is possible to judge how much of a pyramid’s shape is due to migration.
Why migration is age-selective
People move most often when they finish education, look for work, or form a household. Children move with their parents, and older people move less, although retirement migration and return migration exist. The result is a characteristic migration age profile: low in childhood, peaking in the twenties and early thirties, and declining after about 40.
Migration can also be sex-selective. Construction, extraction and agricultural labour schemes recruit mainly men; domestic and care work recruits mainly women. Where one stream dominates, the pyramid becomes lopsided at working ages while the child bands, which are formed by births, stay close to the usual birth sex ratio of about 105 boys per 100 girls.
Immigration: the Gulf labour pattern
Qatar is the clearest example of a pyramid shaped by immigration. In the 2023 estimates, men aged 30–34 outnumber women of the same age by more than three to one (about 368,000 against 115,000). Men aged 25–44 alone make up about 44% of the entire population. At ages 0–4 the two sides are nearly equal.
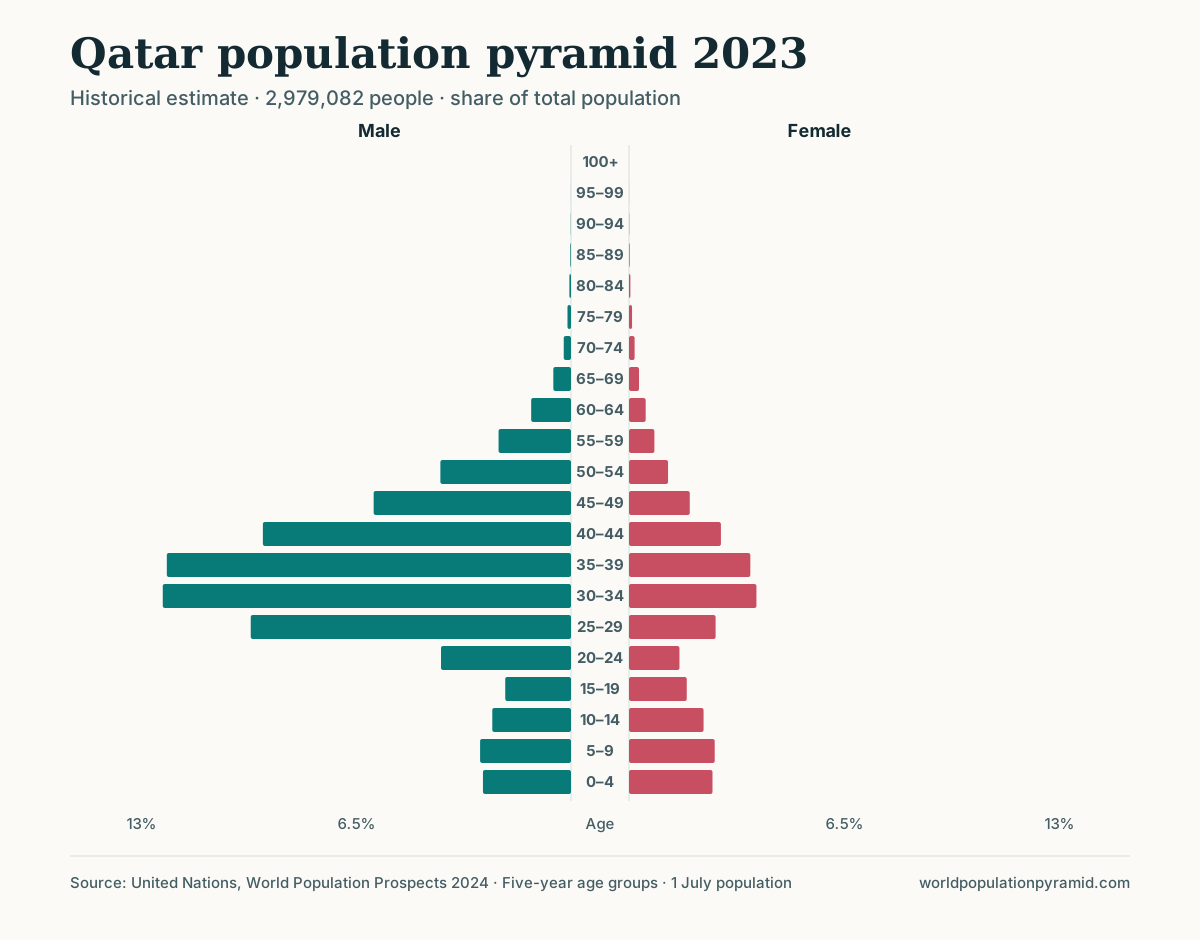
A simple accounting check confirms that births cannot explain this. Qatar recorded about 489,000 births in total from 2000 to 2023, yet there were about 473,000 people aged 35–39 in 2023 alone, people born in Qatar’s much smaller population of the 1980s or abroad. Cumulative net migration over 2000–2023 was about 1.94 million, four times the births of the same period.
Two features follow from this structure. The all-ages sex ratio is extreme: 243.7 males per 100 females in Qatar and 175 in the United Arab Emirates in 2026. And the share aged 65 and over is tiny, 1.7% in Qatar, because many migrants leave before old age. Both states’ death rates are about 1 per 1,000. The Saudi Arabia and Qatar comparison shows a milder version of the same pattern.
Immigration does not always look this dramatic. In Canada, net migration of about 291,000 projected for 2026 is roughly ten times the natural increase (361,000 births minus 331,000 deaths). The largest bands in 2026 are 25–39, but the sexes stay close to balance because family, student and skilled-worker streams include both men and women.
Emigration: hollowed young-adult ages
Emigration produces the opposite shape: a pinch at the ages where people leave. Because emigration from small or middle-income countries often lasts decades, the gap moves upward with the cohorts that experienced it.
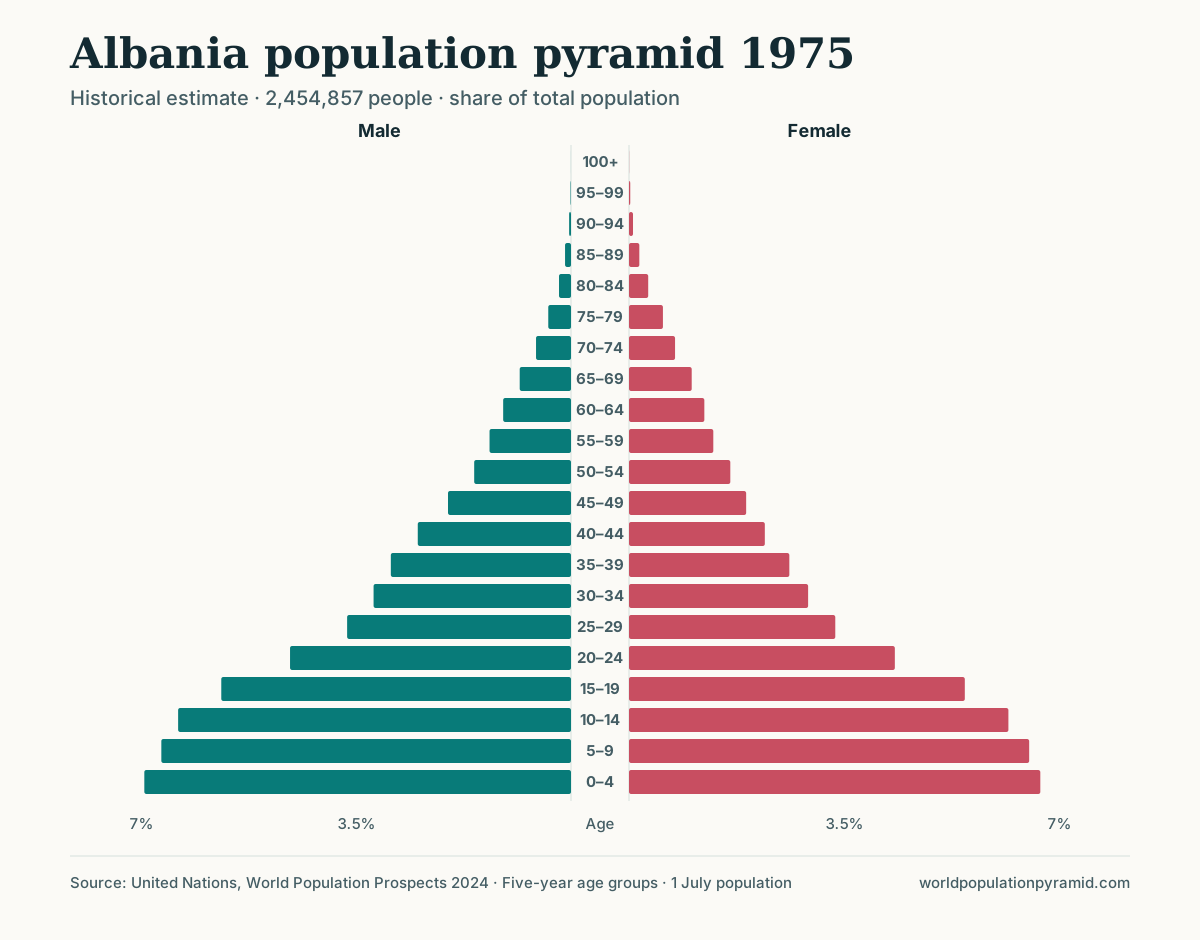
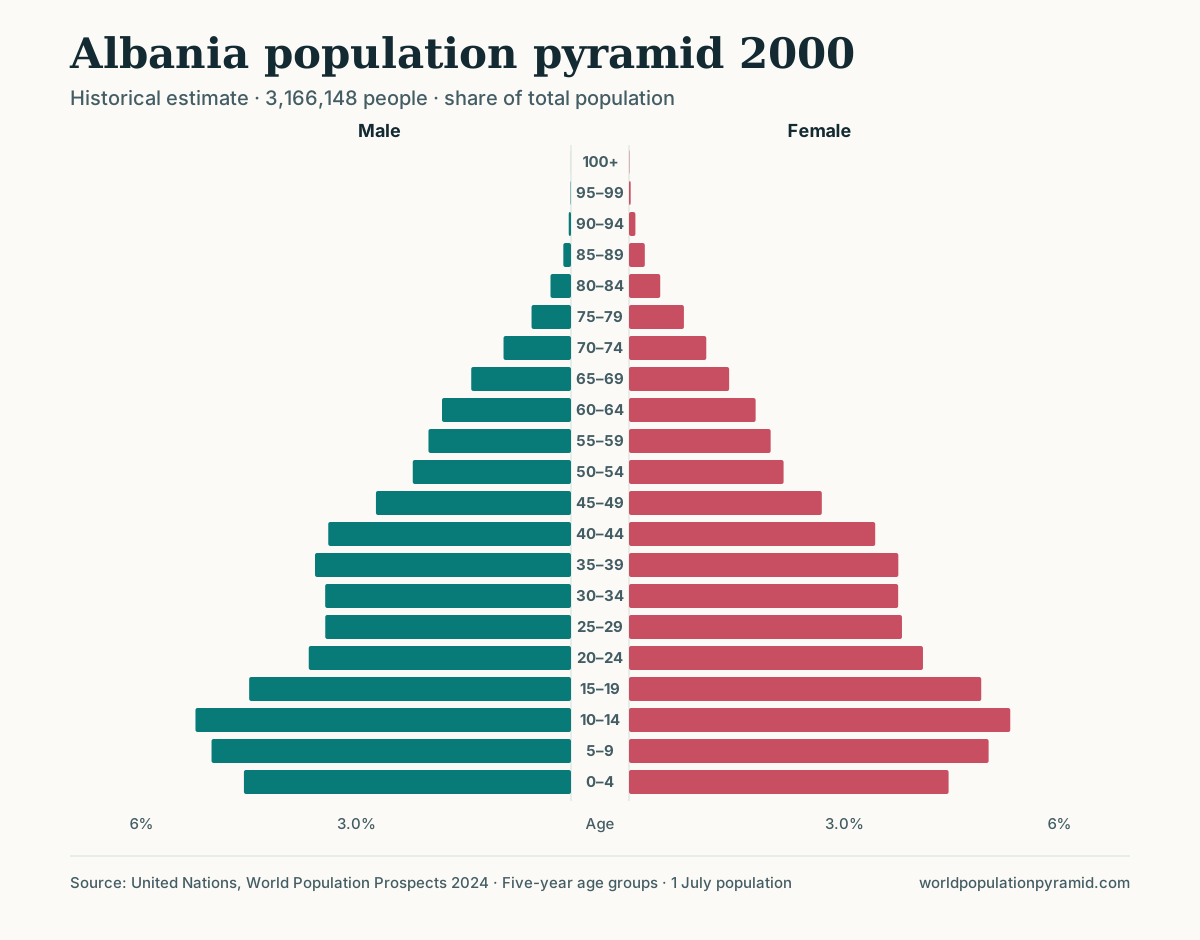
Albania shows this clearly because its 1975 and 2000 pyramids are exactly 25 years apart, so the same birth cohorts can be compared. In 1975 there were about 335,000 children aged 0–4. In 2000, when these children were 25–29, only about 229,000 remained, a loss of about 32%. Mortality alone cannot explain a loss of that size at those ages. The loss was larger among men (36%) than women (27%), which is consistent with male-dominated emigration. Cumulative net migration was about −547,000 from 1950 to 1999 and −808,000 from 2000 to 2023.
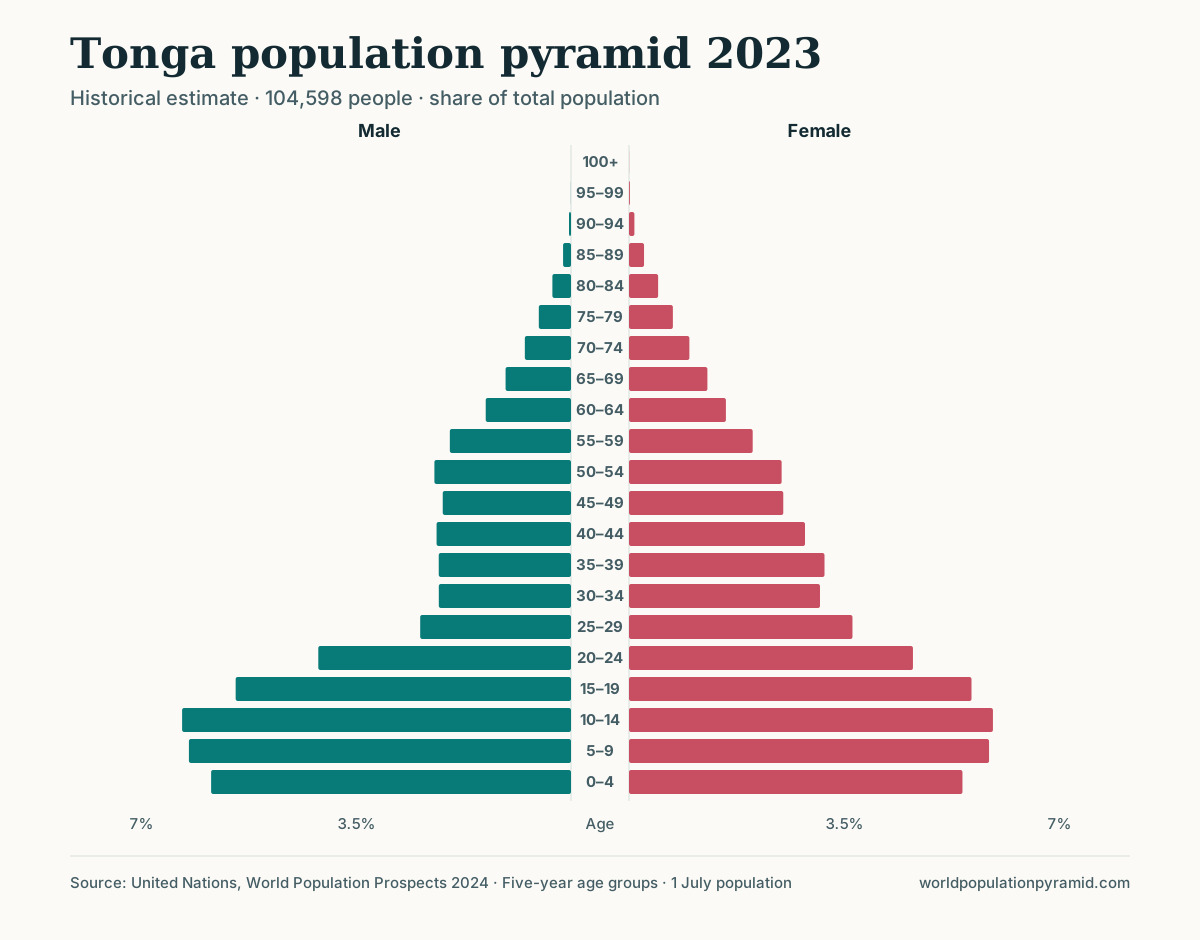
Small island states show the same effect at a larger scale relative to their size. Tonga had about 52,000 more births than deaths between 2000 and 2023, but net migration of about −50,000 removed almost all of that natural increase; the population rose only from about 103,000 to 105,000. In the 2023 pyramid, the 25–29 band is about half the size of the 10–14 band, and the male side is thinner still: 61 men per 100 women at ages 30–34 in 2026.
Emigration also has a delayed effect. People who leave in their twenties have their children abroad, so the birth count at home falls a generation later. Albania’s under-15 share fell from 29.6% in 2000 to a projected 16.3% in 2026, reflecting lower fertility and fewer potential parents.
Refugees and return migration
Forced displacement is less age-selective than labour migration: whole families leave, including children and older people. Its imprint is therefore a general thinning, which can be hard to separate from falling fertility.
Syria recorded cumulative net migration of about −2.19 million from 2000 to 2023. Its 2026 pyramid has a notch at ages 5–9, about 18% smaller than its neighbouring bands, labelled “born about 2017–2021”. Children born to Syrian parents abroad are counted in the population where they live, so a notch dated to those years can reflect both fewer births and births that took place in another country.
Return migration can reverse part of the effect. The UN medium scenario assumes net inflows to Syria of about 306,000 in 2026 and 1.16 million over 2026–2050. Ukraine shows a related assumption: its population is projected to rise from 37.7 million in 2023 to 39.5 million in 2026 although deaths exceed births, which implies assumed net returns in 2024–2025 after cumulative net migration of about −6.15 million in 2000–2023. These figures are assumptions in a scenario, not observed flows, and they are among the least certain numbers in any projection.
How to separate migration from births
A bulge or notch can come from births, deaths, or migration. Five checks help distinguish them on any country page:
- Follow the cohort with the slider. Move the pyramid slider back 25 years and use the outline overlay to compare. A birth cohort is already wide or narrow at ages 0–4. A migration feature appears or grows in adulthood.
- Compare the sexes. Births produce roughly balanced cohorts. A large gap at ages 20–59 between the male and female bars points to sex-selective migration (or, in some countries, war deaths). The largest-age-groups table lists male and female counts for each of the biggest bands.
- Read the “Distinctive cohorts” table carefully. Its “born about” column is calculated from age alone. For a migrant cohort it gives the birth years of people who arrived later, often from another country.
- Check the births, deaths, and migration chart. If the net migration line runs close to or above the births line, migration dominates the shape. The text beside the chart states whether migration or natural change moved the total more since 2000.
- Use the trend table and the age-group calculator. The trend table gives net migration by decade; the age-group calculator gives exact counts and shares for any age range, such as men aged 25–44.
For cross-country context, the net migration rate ranking shows where flows are largest relative to population, and the sex-ratio ranking highlights the labour-migration destinations.
Limitations
Migration is the least precisely measured demographic component. Many countries lack reliable records of who leaves, so net migration is often inferred indirectly, for example as the residual between census counts and recorded births and deaths. Errors in the censuses or vital records are then attributed to migration.
Net figures also hide gross flows. A net migration of zero can conceal large numbers of people leaving and arriving at different ages. Temporary and circular migrants may or may not be counted as residents, depending on national definitions. Finally, projected migration is a scenario assumption: the medium scenario does not forecast policy changes, conflicts, or economic shocks, so treat migration-driven projections as one plausible path. How UN projections work explains the assumptions in more detail.
Sources
- United Nations World Population Prospects 2024
- WPP 2024 methodology report
- UN DESA Population Division: International Migrant Stock
- IOM World Migration Report
Frequently asked questions
Which ages does migration affect most?
Mainly young adults, usually from the late teens to the early forties. Labour migrants and students move at these ages, so immigration widens and emigration narrows the middle of the pyramid rather than its base.
How can you tell whether a bulge comes from migration or from births?
Follow the cohort across years. A birth bulge is already present at ages 0–4 and narrows slowly with age. A migration bulge appears or grows in adulthood, often on one sex only, and the cumulative net migration figure is large relative to births.
Why do Gulf states have so many more men than women?
Their populations include large numbers of mostly male labour migrants aged roughly 20–59. In Qatar's 2026 projection there are 243.7 males per 100 females across all ages, while children under 15 are close to balanced.
Does emigration only remove young adults?
It removes them first, but it also removes their future children. A country that loses many people in their twenties later records fewer births, so the base narrows a generation after the emigration itself.