Birth Rate vs Fertility Rate: Why Age Structure Makes Them Differ
Understand the crude birth rate, total fertility rate, net reproduction rate, and crude death rate, and why countries with similar fertility can have very different birth and death rates.
Three numbers are often reported as if they measured the same thing: the crude birth rate, the total fertility rate, and the net reproduction rate. They answer different questions, and the population pyramid explains most of the gap between them. The same reasoning applies to the crude death rate, which is why some of the longest-lived populations record the most deaths per 1,000 people.
Three measures, three questions
| Measure | Question it answers | Unit | Affected by age structure? |
|---|---|---|---|
| Crude birth rate (CBR) | How many births occurred relative to the whole population? | Births per 1,000 people | Yes, strongly |
| Total fertility rate (TFR) | How many children would a woman have at this year’s age-specific rates? | Births per woman | No |
| Net reproduction rate (NRR) | How many daughters would she have at this year’s fertility and mortality rates? | Daughters per woman | No |
The crude birth rate is births in a year divided by the mid-year population, multiplied by 1,000. In 2026 Japan is projected to record 745,943 births for about 122.4 million people: 6.1 per 1,000. The denominator includes infants, men, and people aged 90, none of whom give birth. That is why it is called “crude.”
The total fertility rate removes that problem. It adds up the age-specific fertility rates (births per woman in each age group) for women aged 15 to 49 in a single year, multiplying by five when the rates are for five-year age groups. The result is the number of children a hypothetical woman would have if she experienced exactly those rates. Because it is built from rates per woman at each age, the number of women at each age does not affect it.
The net reproduction rate counts only daughters and allows for the chance that a girl dies before or during her childbearing years. Roughly, NRR ≈ TFR × the share of births that are girls × the probability of surviving to the mother’s mean age at childbearing. With about 105 boys born per 100 girls and very low mortality, a TFR near 2.1 gives an NRR close to 1.0: each generation of women replaces itself. Where many girls die young, a higher TFR is needed to reach the same NRR. The UN publishes NRR in World Population Prospects; this site’s profiles show TFR, so the explanation here is conceptual.
Same fertility, different birth rates
To see why the measures diverge, hold fertility constant and change the pyramid. In 2026 the United Arab Emirates, Italy, and Japan all have a projected TFR of about 1.2:
| 2026 projection | TFR | Birth rate per 1,000 | Death rate per 1,000 | Aged 65+ |
|---|---|---|---|---|
| United Arab Emirates | 1.21 | 10.3 | 1.0 | 1.8% |
| Italy | 1.22 | 6.4 | 11.4 | 25.6% |
| Japan | 1.23 | 6.1 | 12.8 | 30.2% |
Women in the UAE are not having more children each. A much larger fraction of the population is made up of women at the ages when most births occur: women aged 25–39 are about 13.8% of UAE residents, against about 7.4% in Japan. The same fertility rate applied to nearly twice as many potential mothers per 1,000 residents produces a much higher crude birth rate.
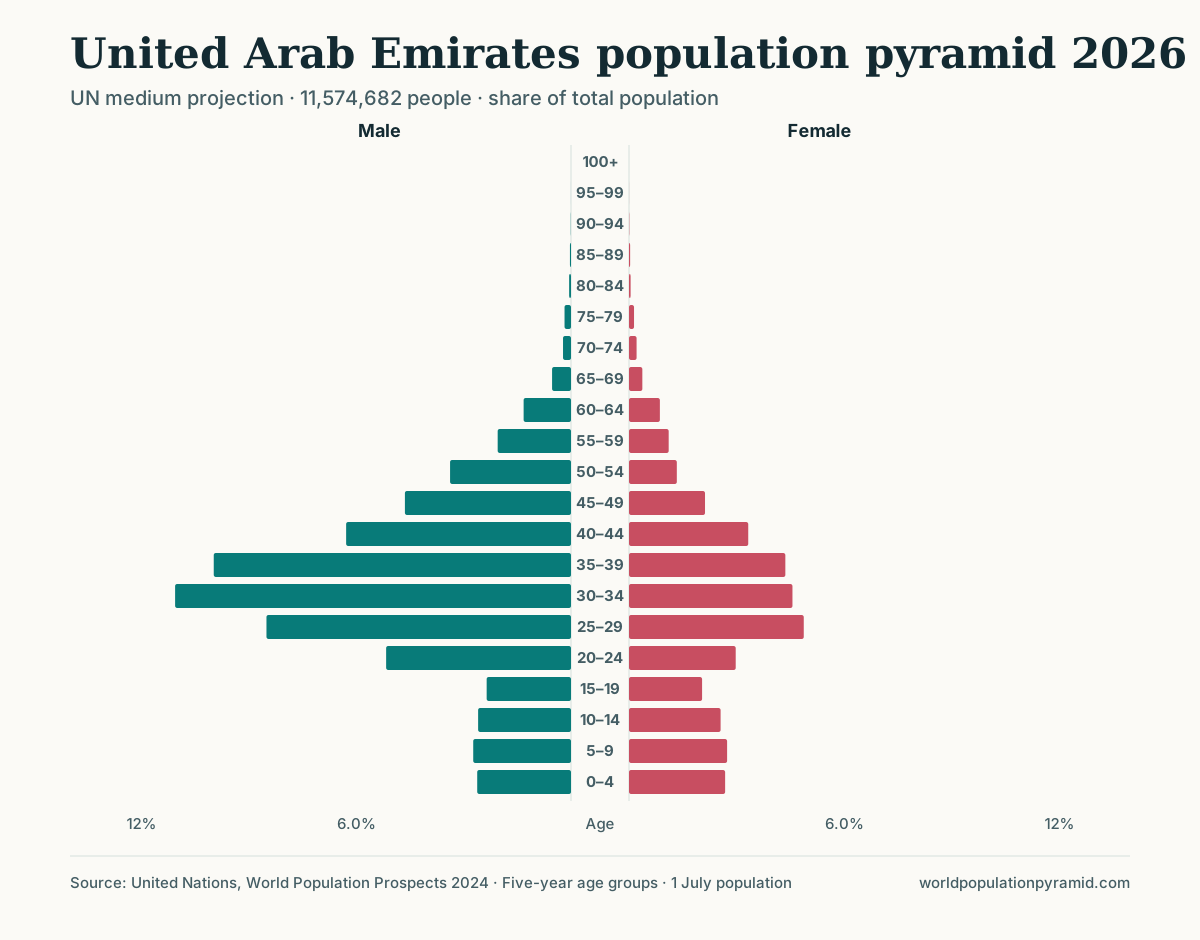
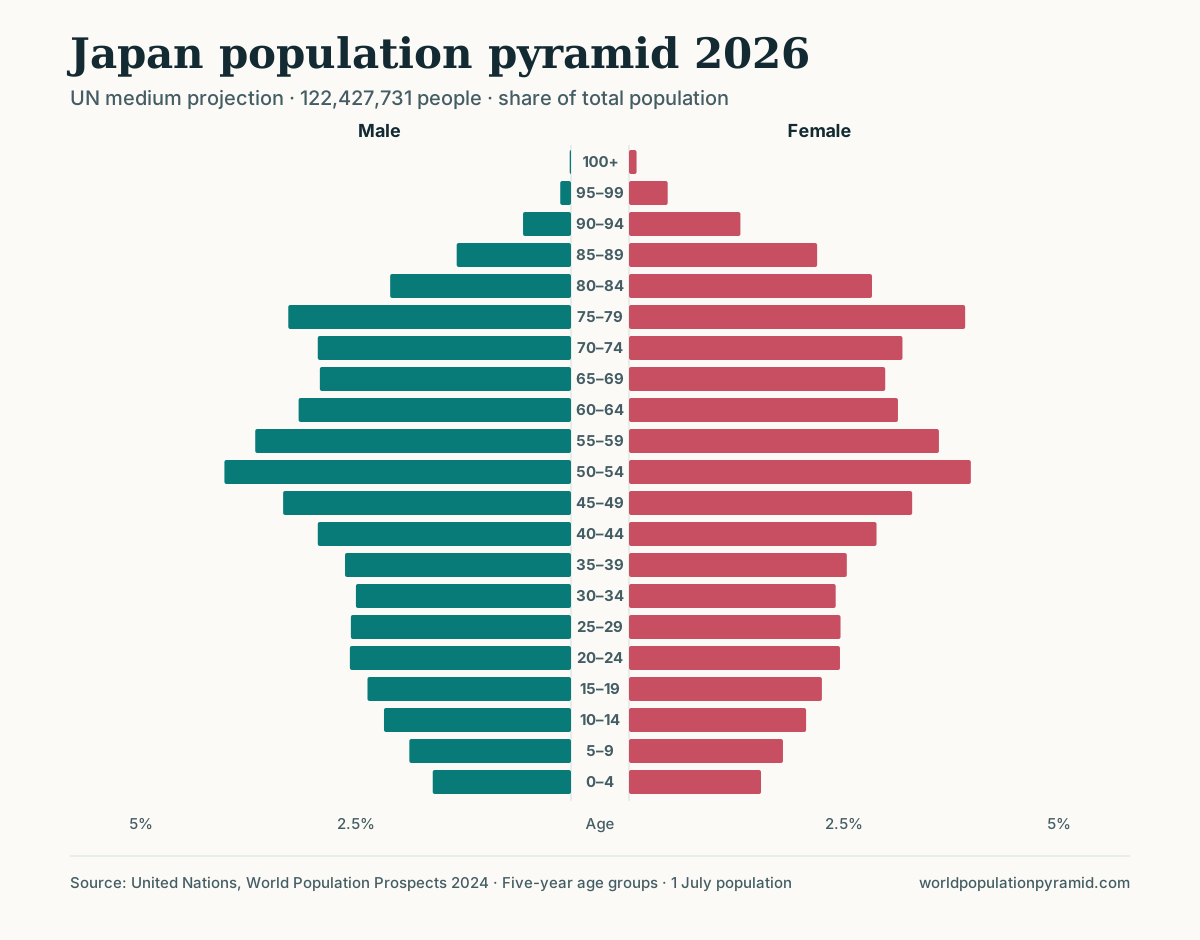
The UAE is an extreme case because migration has filled its working ages, mostly with men: the male bars at ages 30–34 are more than twice as wide as the female bars. Even so, its female bars at prime childbearing ages are proportionally far wider than Japan’s.
The divergence also runs the other way. Bulgaria has a higher TFR than the UAE (1.74 against 1.21) but a lower birth rate (8.9 against 10.3 per 1,000). Its cohorts in their twenties and early thirties, born when fertility was very low, are small, and many of its women are in their forties and fifties, past the ages of peak childbearing.
Why old countries have high death rates
The crude death rate (CDR) has the same structure: deaths in a year per 1,000 mid-year population. Because mortality is concentrated at older ages, a population with many older people records many deaths even when the risk of dying at each age is low.
| 2026 projection | Life expectancy (2023) | Death rate per 1,000 | Aged 65+ |
|---|---|---|---|
| Niger | 61.2 | 8.4 | 2.6% |
| United Arab Emirates | 82.9 | 1.0 | 1.8% |
| Japan | 84.7 | 12.8 | 30.2% |
| Bulgaria | 75.6 | 15.3 | 22.5% |
Niger’s life expectancy is more than 20 years shorter than Japan’s, yet its death rate is lower. The risk of dying is far higher in Niger at most ages; its infant mortality is 61 per 1,000 live births, against 1.6 in Japan. But 45.8% of Niger’s population is under 15 and only 2.6% is 65 or older, so few people are at the ages where most deaths occur. Japan has the opposite structure: about 1.56 million deaths and 746,000 births in 2026, more than two deaths per birth.
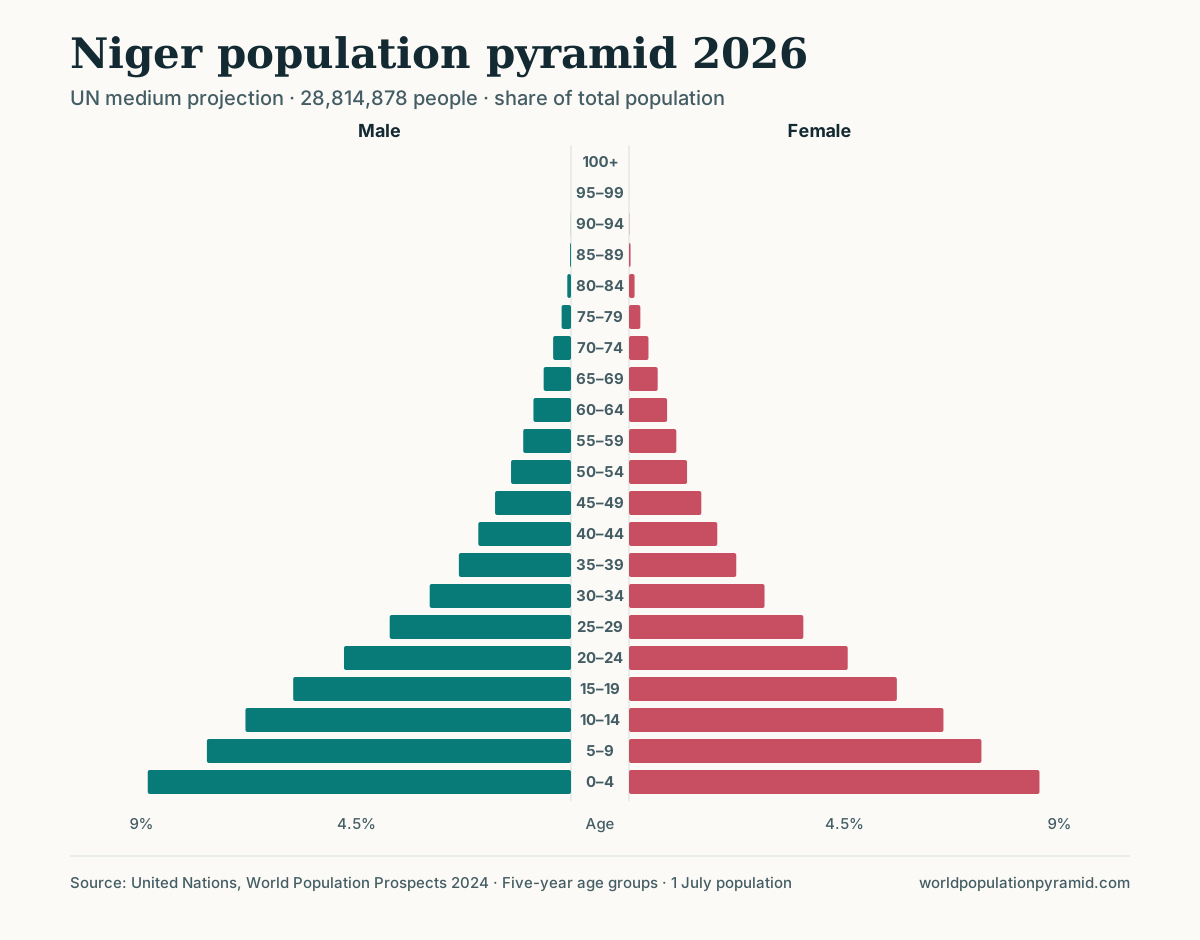
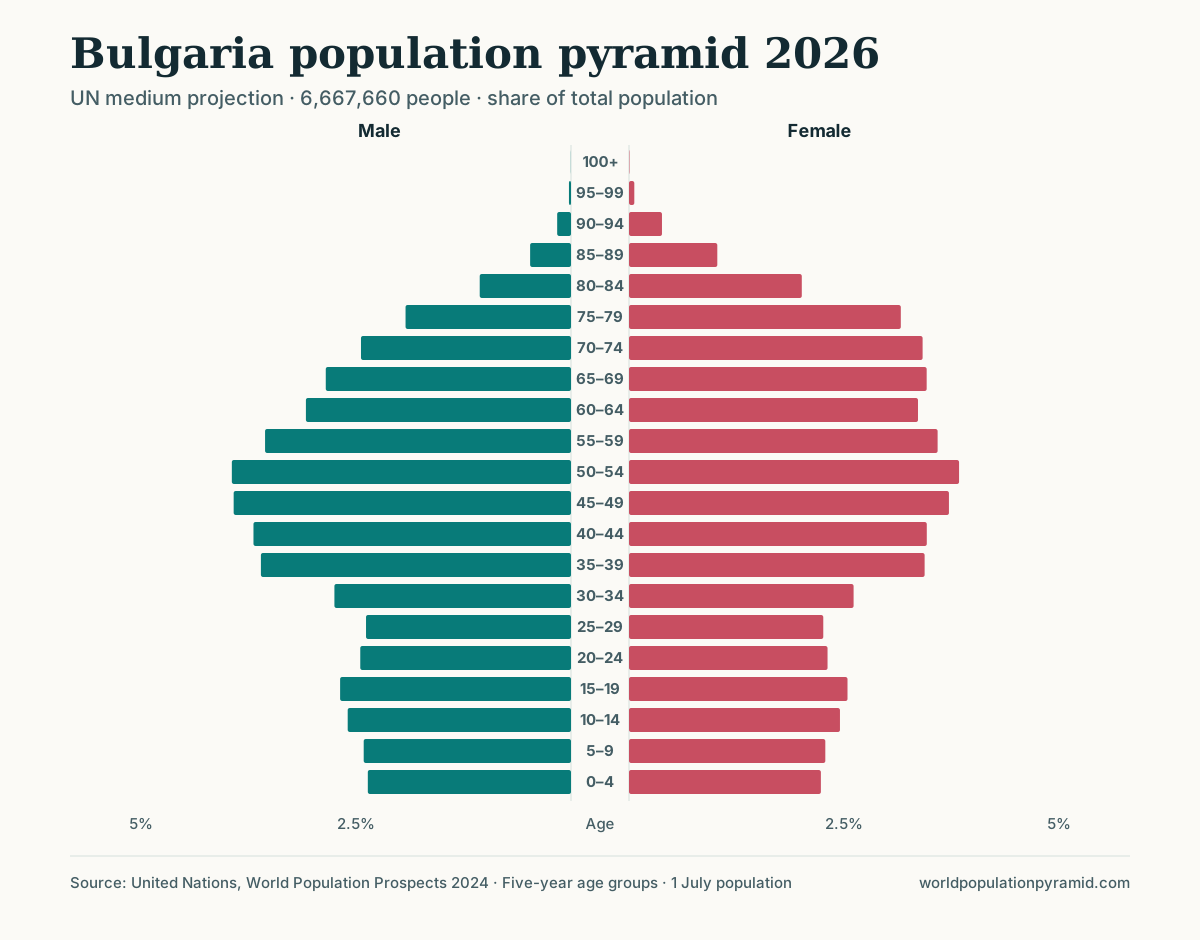
Bulgaria combines both forces: life expectancy below Japan’s or Italy’s (75.6 against 84.7 and 83.7 years) and an old population. Together they give one of the highest death rates in the dataset.
Watching the gap open over time
As large cohorts age, the crude death rate can rise for decades while life expectancy also rises. South Korea has a 2026 death rate of 7.5 per 1,000, well below Japan’s, because its largest cohorts are still in their fifties and early sixties. Its 65+ share is projected to rise from 21.4% in 2026 to 39.7% in 2050, and its death rate will rise with it even if survival at each age keeps improving.
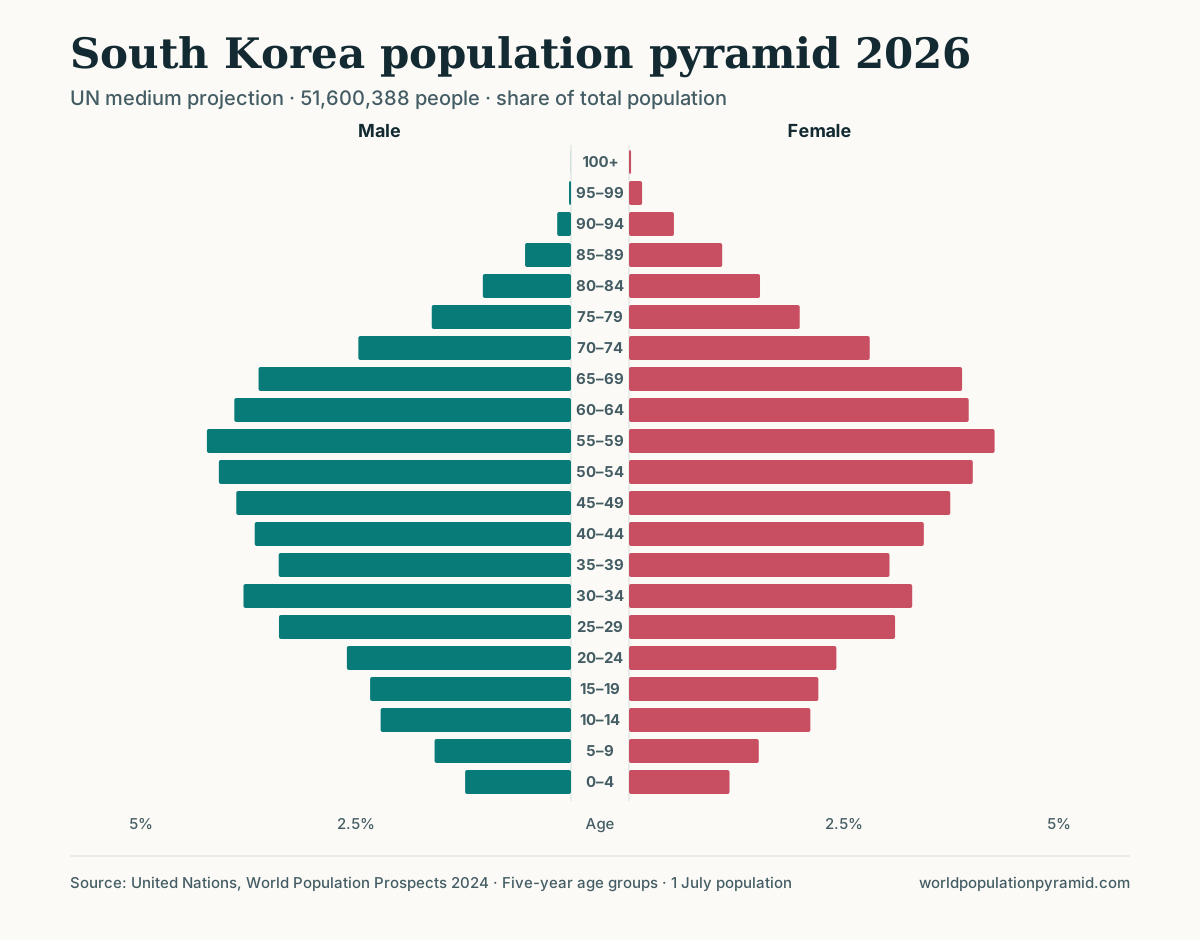
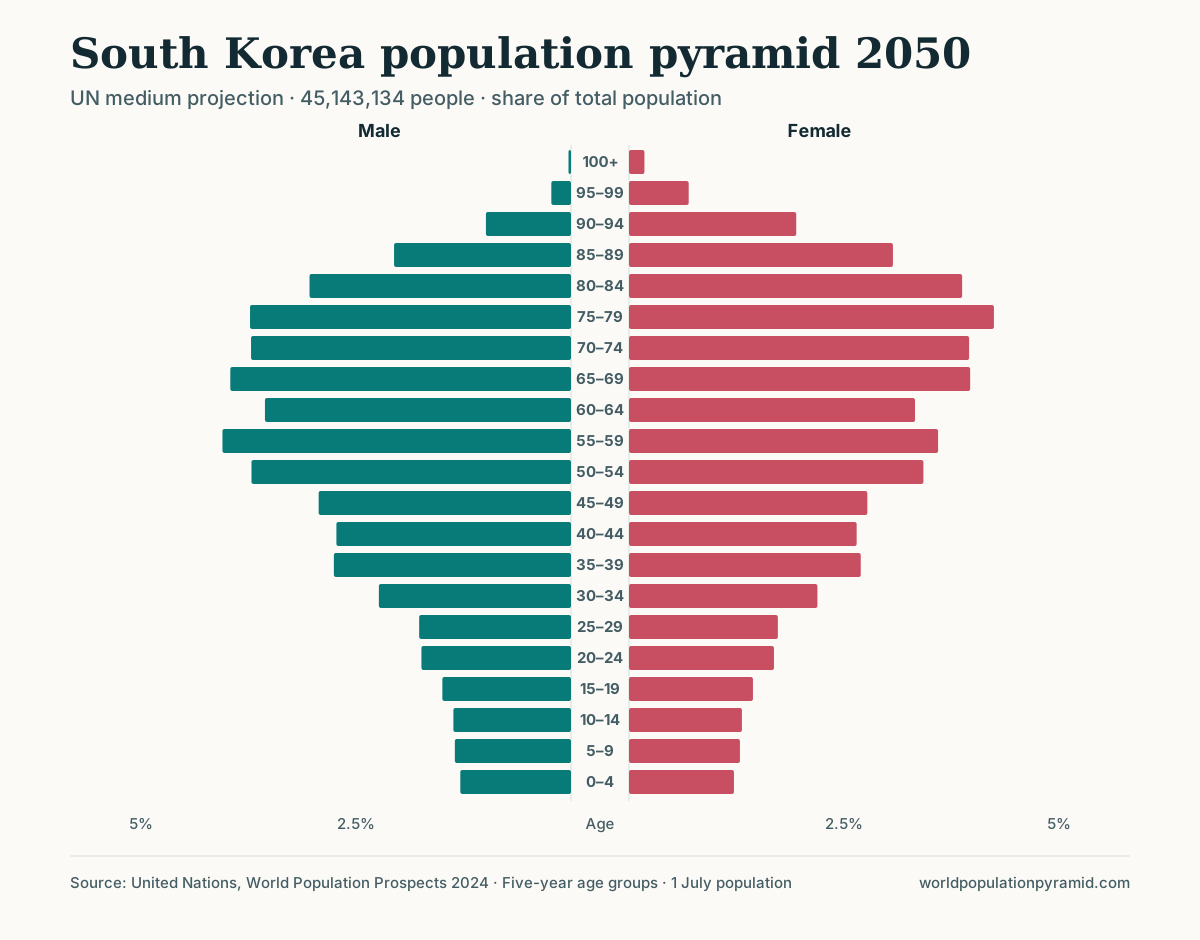
South Korea’s 2026 TFR of 0.76 is among the lowest in the world, and its birth rate of 4.8 per 1,000 is the lowest of the countries discussed here: very low fertility is applied to cohorts in their late twenties and thirties that are already smaller than the generations now aged 50–64.
How to check this on any country page
- Compute the crude birth rate. The trend table lists population, fertility (TFR) and births by decade. Divide births by population and multiply by 1,000, then compare countries of similar TFR using the fertility rate ranking and the birth rate ranking.
- Measure potential mothers. In the age-group calculator, select ages 25 to 35–39, read the female count, and divide by the total population. A larger share means more births per 1,000 at the same TFR.
- Measure the older population. Select 65 to 100+ in the calculator, then compare with the death rate ranking. A high 65+ share with high life expectancy is the signature of “old, long-lived, many deaths.”
- Follow the cohorts. Move the pyramid slider forward, or set the outline overlay to 2050. If the widest bands are approaching their seventies, expect the death rate to rise.
- Read the components chart. The births, deaths, and migration chart shows counts. Converging lines show where natural increase is heading; the natural decrease guide explains what happens after they cross.
Limitations
- Crude rates answer a different question, not a wrong one. For how fast a population grows through births and deaths, CBR minus CDR (the rate of natural increase) is exactly what is needed. For comparing childbearing or health, use age-specific or age-standardized measures.
- TFR is a period measure. It summarizes one year’s rates, not the completed family size of real women. When births are delayed, period TFR can fall temporarily. Mean ages at childbearing of 33.4 in South Korea and 28.3 in Bulgaria show how different timing can be.
- NRR is hypothetical. It assumes current conditions persist; it is not a forecast.
- Migration distorts both crude rates. Populations of young labour migrants, as in the UAE or Qatar (death rate 1.0 per 1,000), have low death rates because older residents are few, not because mortality at each age is unusually low.
- Values through 2023 are UN estimates; 2026 and later are medium-scenario projections.
For how fertility relates to long-run replacement, continue with replacement-level fertility; for the similar trap with ages, see median age vs life expectancy.
Sources
- United Nations World Population Prospects 2024
- United Nations WPP 2024 methodology report
- Population Reference Bureau: glossary of demographic terms
- World Bank: birth rate, crude (per 1,000 people)
- World Bank: fertility rate, total (births per woman)
- World Bank: death rate, crude (per 1,000 people)
Frequently asked questions
What is the difference between birth rate and fertility rate?
The crude birth rate counts births per 1,000 people of all ages in a year. The total fertility rate estimates births per woman across a lifetime at current age-specific rates, so it is not affected by how many people are at each age.
Can two countries with the same fertility rate have different birth rates?
Yes. Japan and the United Arab Emirates have almost identical fertility in 2026 (1.23 and 1.21), yet the UAE's birth rate is 10.3 per 1,000 and Japan's is 6.1, because a much larger share of the UAE population is at peak childbearing ages.
What is the net reproduction rate?
The average number of daughters a woman would have if she experienced current age-specific fertility and mortality rates throughout her life. A value of 1.0 means each generation of women would exactly replace itself in the long run.
Why do countries with long life expectancy have high death rates?
The crude death rate divides deaths by the whole population. When a large share of people are old, deaths are frequent even if mortality at each age is low. Japan's death rate is 12.8 per 1,000 with a life expectancy near 85.