Natural Decrease and Population Decline: When Deaths Exceed Births
Learn the difference between natural decrease and total population decline, how migration can offset or reinforce it, when it typically begins, and how it appears in a population pyramid.
Natural decrease means a population records more deaths than births. Population decline means the total number of residents falls. The two are often treated as the same thing, but migration sits between them, and the gap can last for decades.
The accounting identity is exact:
Population change = (births − deaths) + (immigrants − emigrants)
The first bracket is natural change. When it is negative, the population is in natural decrease. Whether the total falls depends on the second bracket.
Natural decrease vs total decline
The same identity works with rates per 1,000 people; dividing the sum by 10 gives the annual growth rate in percent. The 2026 projections show three different outcomes:
| 2026 projection | Births per 1,000 | Deaths per 1,000 | Net migration per 1,000 | Growth |
|---|---|---|---|---|
| Belgium | 8.6 | 9.8 | +2.5 | +0.12% |
| Germany | 8.2 | 12.5 | +1.9 | −0.23% |
| Japan | 6.1 | 12.8 | +1.1 | −0.56% |
| Bulgaria | 8.9 | 15.3 | −0.9 | −0.73% |
- Belgium: natural decrease, but immigration more than offsets it, so the total grows.
- Germany and Japan: immigration offsets only part of the natural decrease, so the total falls.
- Bulgaria: natural decrease and net emigration reinforce each other.
The United Kingdom sits on the boundary. It is projected to record 678,001 births and 677,695 deaths in 2026, almost exactly in balance; net migration of 364,099 provides nearly all of its growth.
Migration can hold the total up for decades
Annual figures hide how large the offset becomes over time. Between 2000 and 2023:
| 2000–2023 (estimates) | Births minus deaths | Net migration | Population, 2000 → 2023 |
|---|---|---|---|
| Germany | −4.19 million | +7.13 million | 81.8 → 84.5 million |
| Italy | −2.63 million | +4.81 million | 57.3 → 59.5 million |
| Japan | −6.00 million | +3.16 million | 127.0 → 124.4 million |
| Bulgaria | −1.05 million | −0.21 million | 8.0 → 6.8 million |
Germany recorded about 4.2 million more deaths than births over the period, yet its population was higher in 2023 than in 2000. In Italy, natural decrease began in 1993 but the population did not peak until 2014. In Japan, migration was too small to bridge the gap for long: deaths first exceeded births in 2005, and the population peaked four years later, in 2009.
The columns do not sum exactly, because annual estimates are rounded, mid-year populations are compared, and births and deaths include those of migrants.
When natural decrease typically starts
Natural decrease follows low fertility, but with a long and variable lag. Small birth cohorts must first reach the ages when most births occur, and large older cohorts must reach the ages when most deaths occur.
| Country | Deaths first exceed births | Population peak |
|---|---|---|
| Germany | 1972 | 2024 (projected) |
| Bulgaria | 1990 | 1988 |
| Russia | 1992 | 1991 |
| Italy | 1993 | 2014 |
| Japan | 2005 | 2009 |
| Spain | 2015 | 2023 |
| Taiwan | 2019 | 2019 |
| South Korea | see limitations | 2020 |
The lag varies widely. Germany’s fertility was 2.02 in 1970, only just below replacement, when natural decrease began in 1972. Japan’s fertility had fallen to 1.74 by 1980, but natural decrease did not arrive until 2005: its largest generation, born around 1950, was then only around 30.
Bulgaria and Russia show the reverse order: their populations peaked a year or two before natural decrease began. In Bulgaria, emigration was already removing people; net emigration totalled about 0.97 million between 1950 and 1999.
Projections extend the list. In the medium scenario, deaths first exceed births in France in 2027, the Netherlands in 2030, Canada in 2032, the United States in 2042, Brazil in 2043, India in 2063 and Bangladesh in 2077. In 69 countries and areas, including Niger, Nigeria, Pakistan, Australia, and the United Arab Emirates, births stay above deaths through 2100.
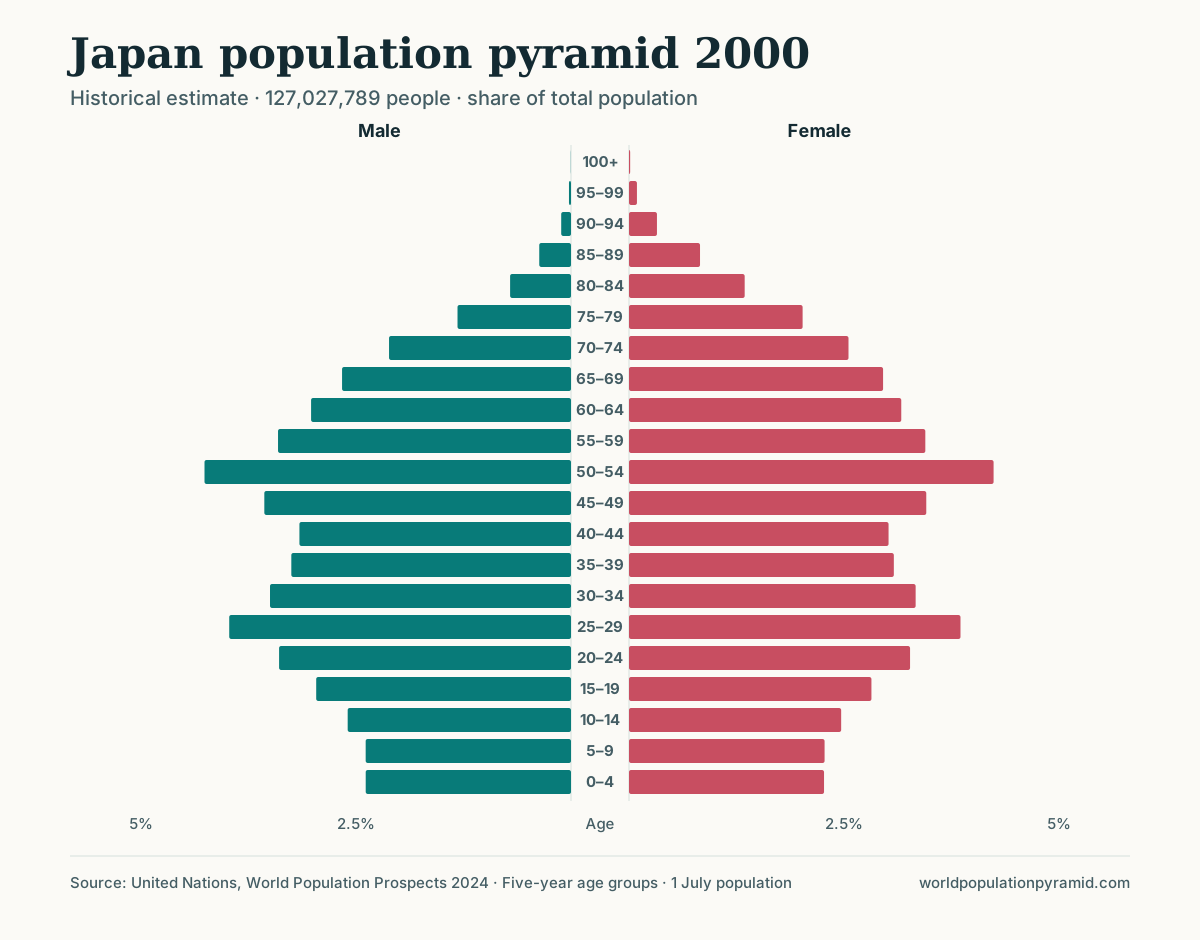
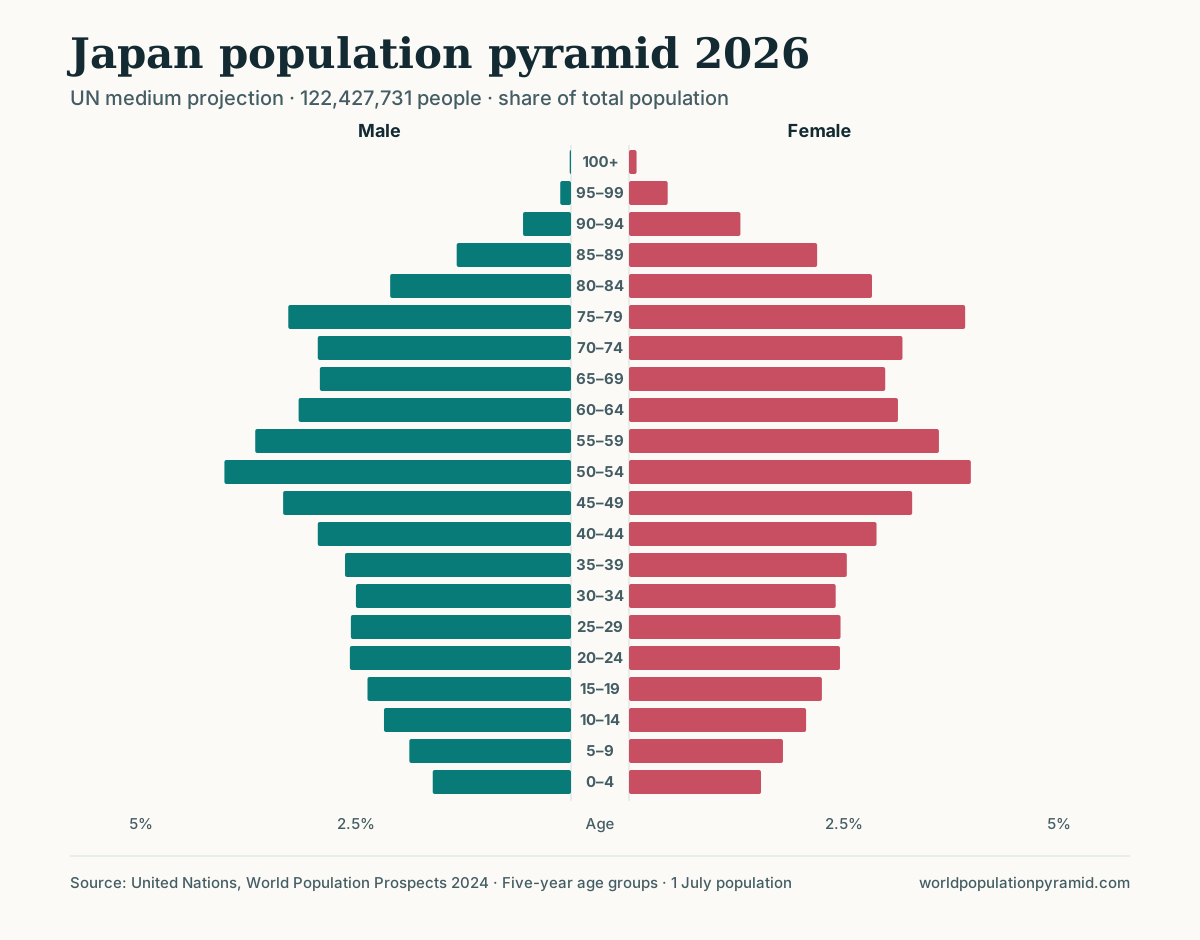
What natural decrease looks like in a pyramid
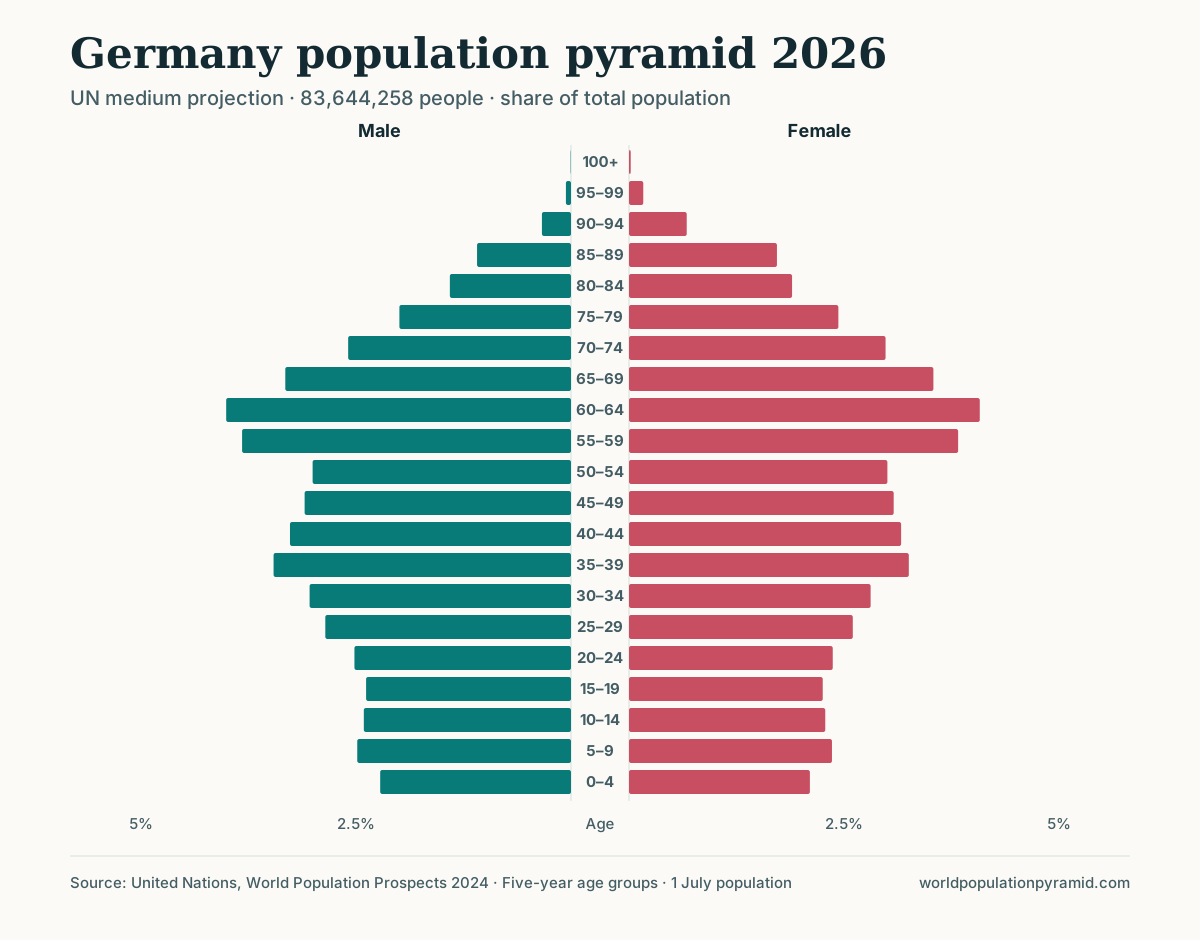
A pyramid cannot show births and deaths directly, but three features make natural decrease likely:
- A base narrower than the bands of potential parents. When the 0–4 group is much smaller than the cohorts aged 25–39, each new generation starts smaller.
- Large cohorts at or approaching age 70. Deaths are concentrated at older ages; when the widest bands reach them, deaths rise even if survival improves.
- Small young-adult cohorts. They will produce fewer births in the next decade, whatever the fertility rate.
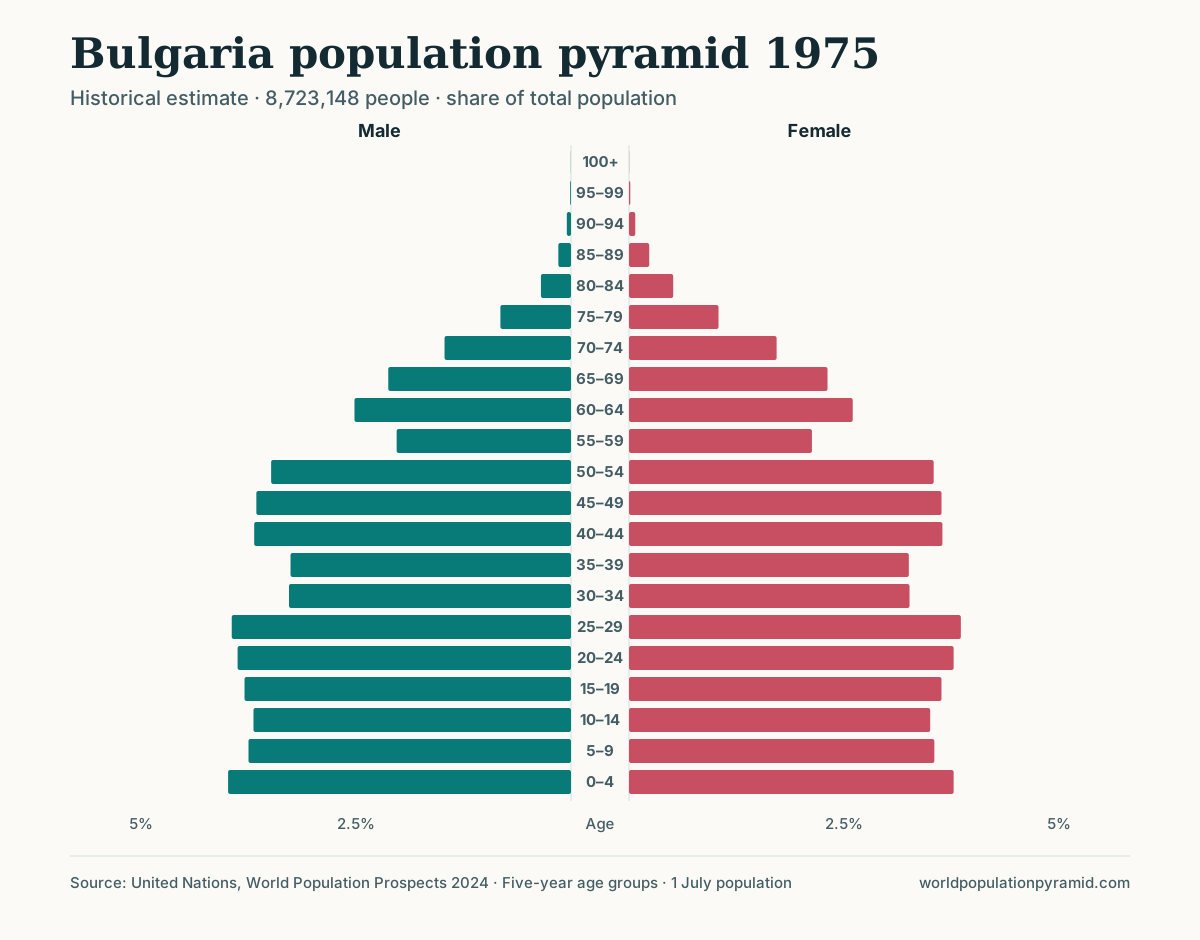
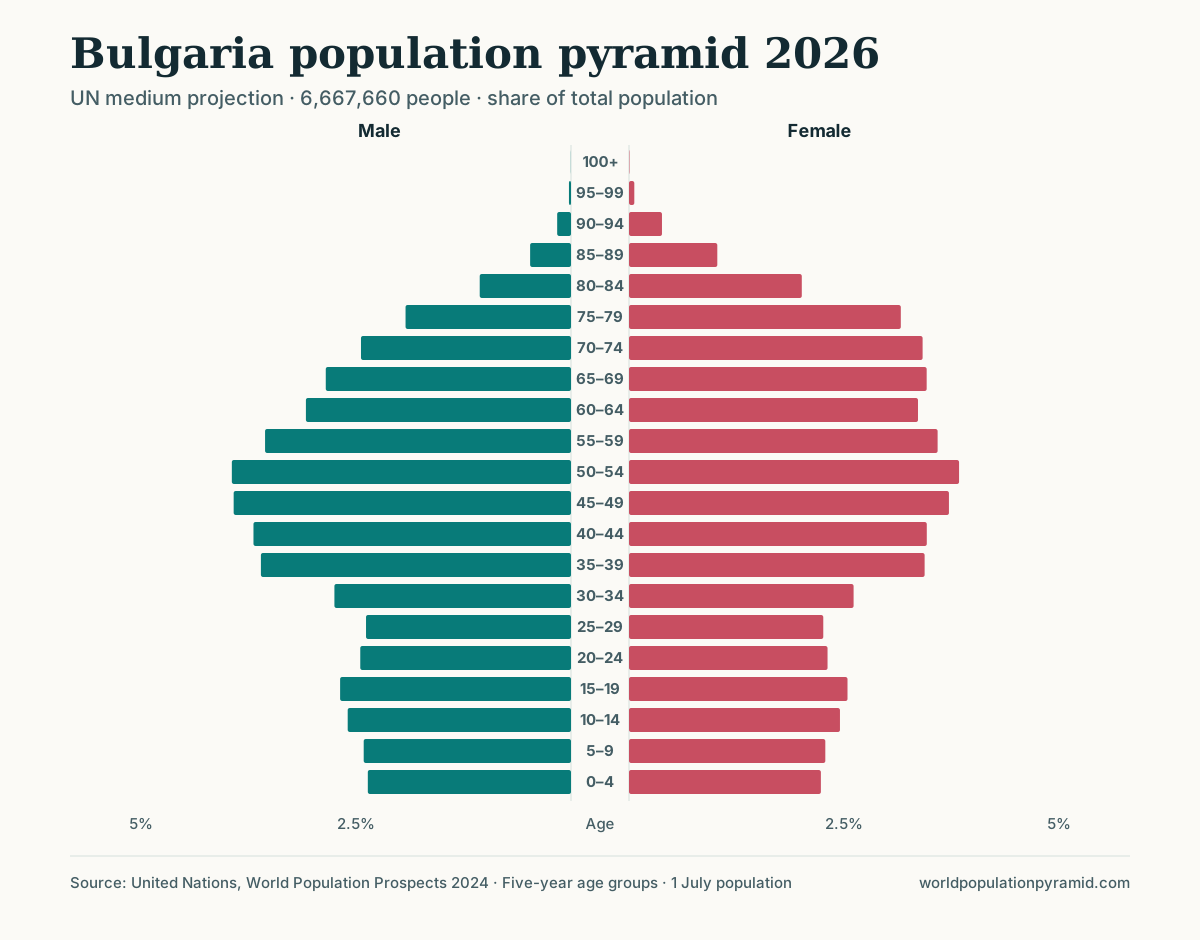
Germany shows the role of migration within the same shape. Its base is narrow, but its young-adult bands are wider than its child bands, a pattern consistent with immigration concentrated at working ages.
How to check natural decrease on any country page
- Read the turning point. The “Distinctive cohorts and turning points” section states whether deaths exceed births in 2026, the year since which they have done so (and any earlier episode), or the projected year when they will.
- Find the crossing in the components chart. On the births, deaths, and migration chart, the point where the deaths line rises above the births line marks natural decrease. If the net migration line is higher than the gap, the total still grows.
- Confirm with the trend table. Subtract deaths from births for a decade, add net migration, and check the sign against the growth column.
- Look for the shape. Use the pyramid slider, or set the outline overlay to 2050, and watch whether the widest bands move into their seventies while the base stays narrow.
- Quantify the cohorts. In the age-group calculator, compare ages 0–4 with ages 25 to 35–39, and ages 70 to 100+ in 2026 and 2050.
- Compare across countries. The deaths-exceed-births ranking, net migration rate ranking, and fastest-declining populations separate natural change from total change.
Limitations
- “First year” is not always the start of a lasting trend. The turning-point year is the first year since 1950 with more deaths than births. For South Korea and North Korea that is 1950, during the Korean War; for China, 1960, during the famine; Cambodia’s is 1975 and Rwanda’s 1994. Each crisis was followed by long periods of natural increase. South Korea’s current natural decrease is a separate, recent episode: in 2026 it is projected to record about 250,000 births and 385,000 deaths.
- Short episodes can reverse. Belgium’s first recorded year of natural decrease is 1975, yet its population is projected to keep growing until 2044.
- Migration is the least certain component. Net migration is often estimated as a residual, and medium-scenario assumptions can change sharply between UN revisions.
- Projected years are scenario results. Dates after 2023 depend on assumed fertility, mortality and migration; a modest change in fertility can move a projected crossing by years.
- Natural decrease is not a verdict. It describes the balance of two flows. Its consequences depend on health at older ages, labour-force participation, migration policy and public institutions.
For why a narrow base does not always mean immediate decline, see the constrictive pyramid guide; for why birth and death rates diverge from fertility and life expectancy, see birth rate vs fertility rate.
Sources
- United Nations World Population Prospects 2024
- United Nations WPP 2024 methodology report
- United Nations Population Division
- Eurostat glossary: natural population change
- Population Reference Bureau: glossary of demographic terms
Frequently asked questions
What is natural decrease?
Natural decrease occurs when a population records more deaths than births in a period, usually a year. It ignores migration.
Does natural decrease mean the population is shrinking?
Not necessarily. Total change is births minus deaths plus net migration. Belgium has more deaths than births in 2026 but is projected to grow by 0.12% because net migration is larger than the natural decrease.
When did deaths start exceeding births in Japan?
In the UN estimates, Japan's deaths first exceeded births in 2005. Its population peaked in 2009 at about 128.2 million.
Which countries will never have natural decrease?
In the UN medium scenario, 69 countries and areas, including Niger, Nigeria, Pakistan, Australia and the United Arab Emirates, have more births than deaths in every year through 2100. That is a projection, not a certainty.