The Demographic Dividend: When a Population Pyramid Opens an Economic Window
Learn what the demographic dividend is, how the first and second dividends differ, why the window is an opportunity rather than a guarantee, and how to see it in a pyramid.
The demographic dividend is the economic growth potential that arises from a change in age structure. When fertility falls after a period of high birth rates, the number of children grows more slowly than the number of adults. For several decades the population is concentrated at working ages, roughly 15–64, and there are relatively few children and older people for each working-age adult.
UNFPA describes it as growth potential that can result “mainly when the share of the working-age population (15 to 64) is larger than the non-working-age share”. The key word is potential. A pyramid shows the opportunity; it does not show whether a country uses it.
How the window appears in a pyramid
The dividend window opens as the pyramid changes from a triangle to a shape with a wide middle:
- Fertility falls. The newest bands at the base stop widening, then narrow.
- Large cohorts move up. The children born during high fertility reach working ages, so the bars between 15 and 64 become the widest part of the chart.
- Older ages are still small. Because survival to old age was lower in the past and older cohorts were born into a smaller population, the top remains narrow.
- The window closes. The large cohorts cross 65, the smaller cohorts born after the fertility decline make up the working ages, and the working-age share falls.
The age dependency ratio summarises the same change: it falls while the window is opening and rises as it closes. The age dependency ratio guide explains the calculation and its limits.
The first and second dividend
Economists Ronald Lee and Andrew Mason distinguish two dividends.
The first dividend is the accounting effect of age structure. If the labour force grows faster than the population as a whole, output per person can rise even when output per worker does not. Lee and Mason note that this period can last five decades or more, but it is transitory: once the large cohorts age, the same arithmetic works in reverse.
The second dividend can follow. A population concentrated at older working ages, expecting a long retirement, has a strong incentive to accumulate assets. If those savings are invested productively, capital per worker rises and income can grow more permanently. Unlike the first, the second dividend is not visible in the pyramid itself; it depends on savings behaviour, pension design, and financial systems.
An opportunity, not an automatic outcome
A rising working-age share is only valuable if working-age people are productive. The gains depend on:
- jobs, so that additional adults are employed rather than unemployed or underemployed;
- education and health, which determine productivity;
- women’s participation in paid work, which often rises as family size falls;
- savings and investment, which convert the gains into capital;
- governance and infrastructure, which make investment productive.
Lee and Mason describe the dividend period as “a window of opportunity rather than a guarantee”, and UNFPA notes that countries can miss it. A wide middle in the pyramid with large numbers of young adults and few jobs can coincide with unemployment and emigration rather than growth.
East Asia: a window opened and closing
South Korea is the textbook case. Its total fertility rate fell from 5.99 in 1960 to 2.73 in 1980 and 1.6 in 1990. The working-age share rose from 54.4% in 1950 and 57.9% in 1975 to 71.9% in 2000. In 2000 there were about 39 people under 15 or aged 65+ for every 100 people aged 15–64.
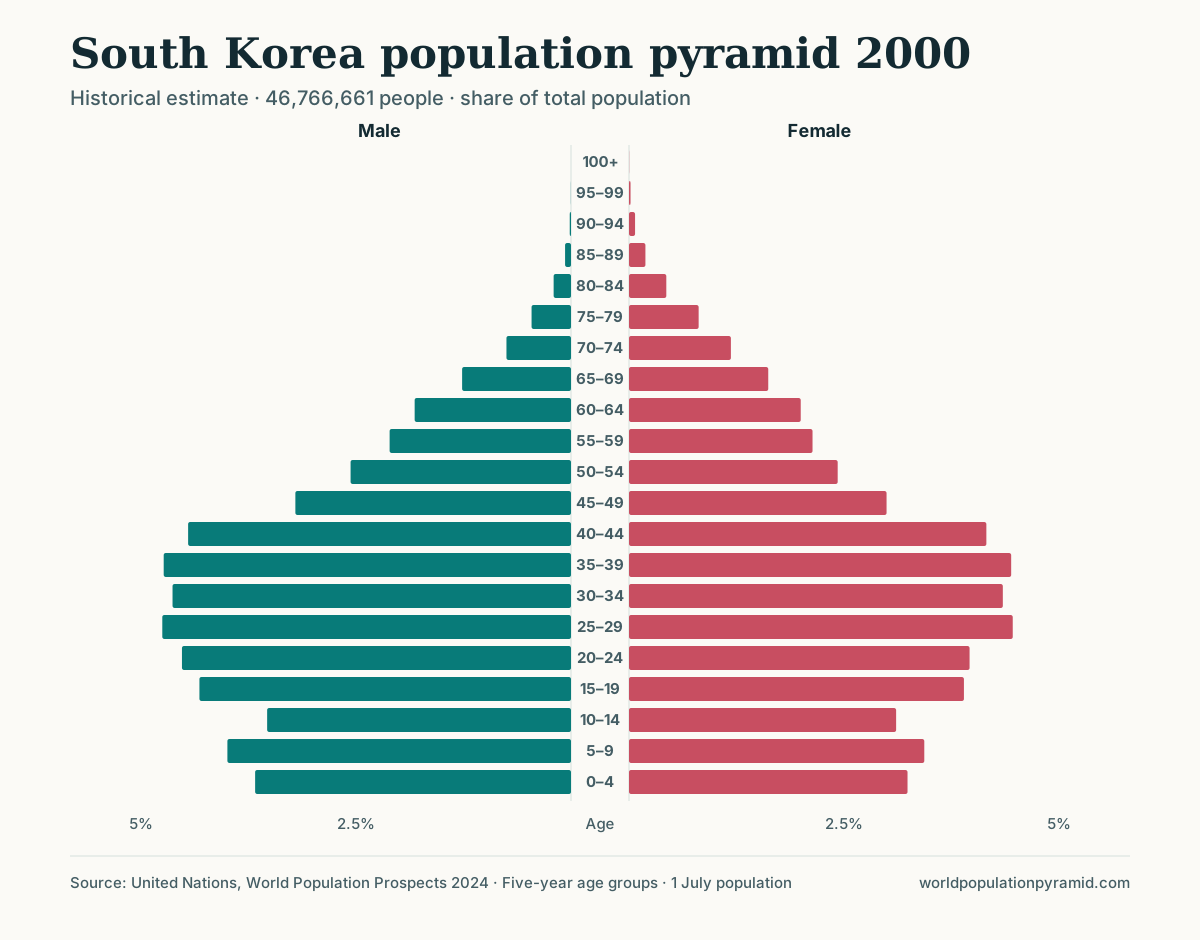
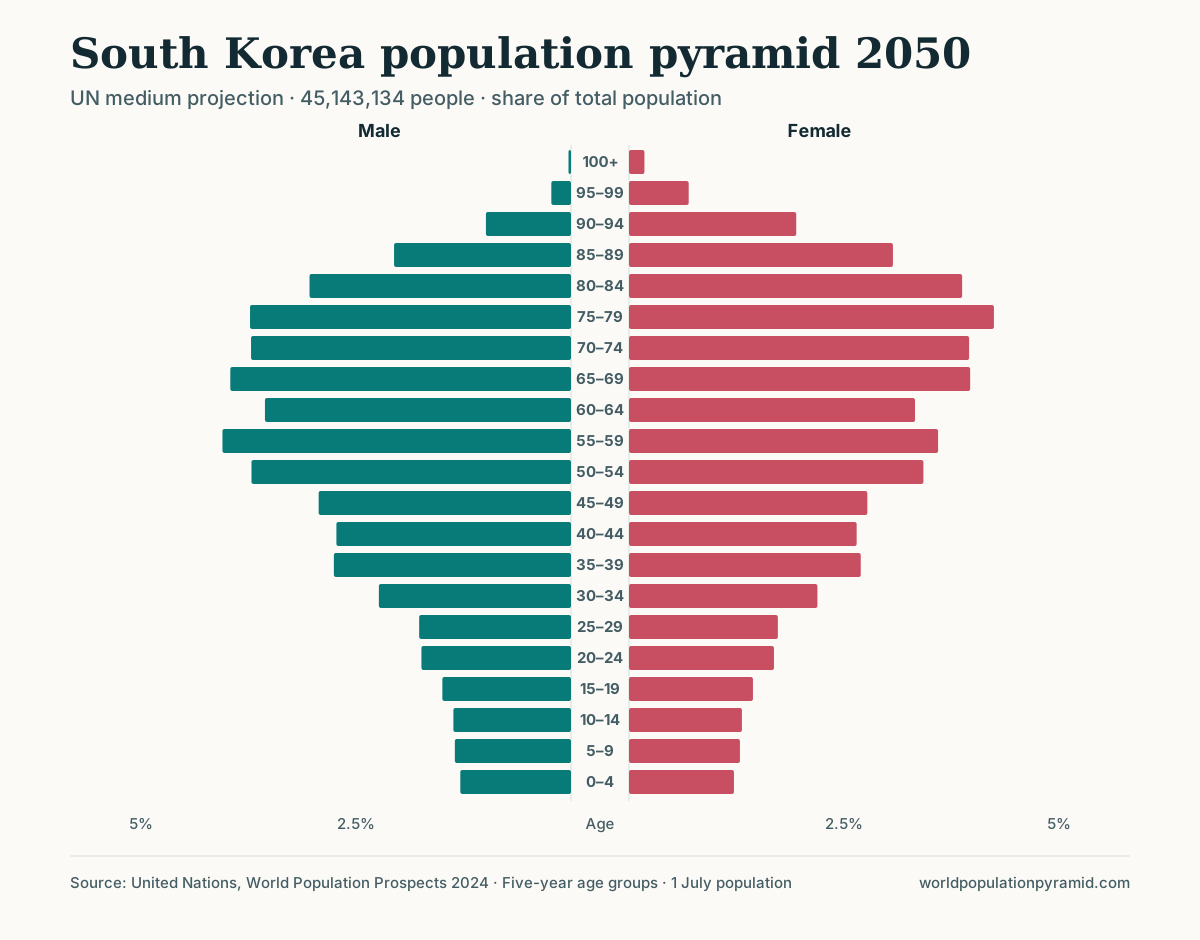
The window is now closing. The working-age share is projected at 68.7% in 2026 and 52.5% in 2050, when there would be about 90 people under 15 or 65+ for every 100 of working age. The same cohorts that created the dividend create the ageing that follows it.
China followed a similar path on a larger scale. Its fertility fell from 6.08 in 1970 to 2.74 in 1980; the working-age share rose from 60.2% in 1950 to 68.4% in 2000 and a projected 70.1% in 2026, before falling to 59.1% by 2050. The Japan and China comparison shows a country whose window closed earlier beside one where it is closing now.
Rapid economic growth in these countries coincided with their demographic windows, but age structure was only one factor; policy, investment, and institutions determined how much of the potential was realised. Their experience shows what a window can support, not what it guarantees.
Sub-Saharan Africa: a window still opening
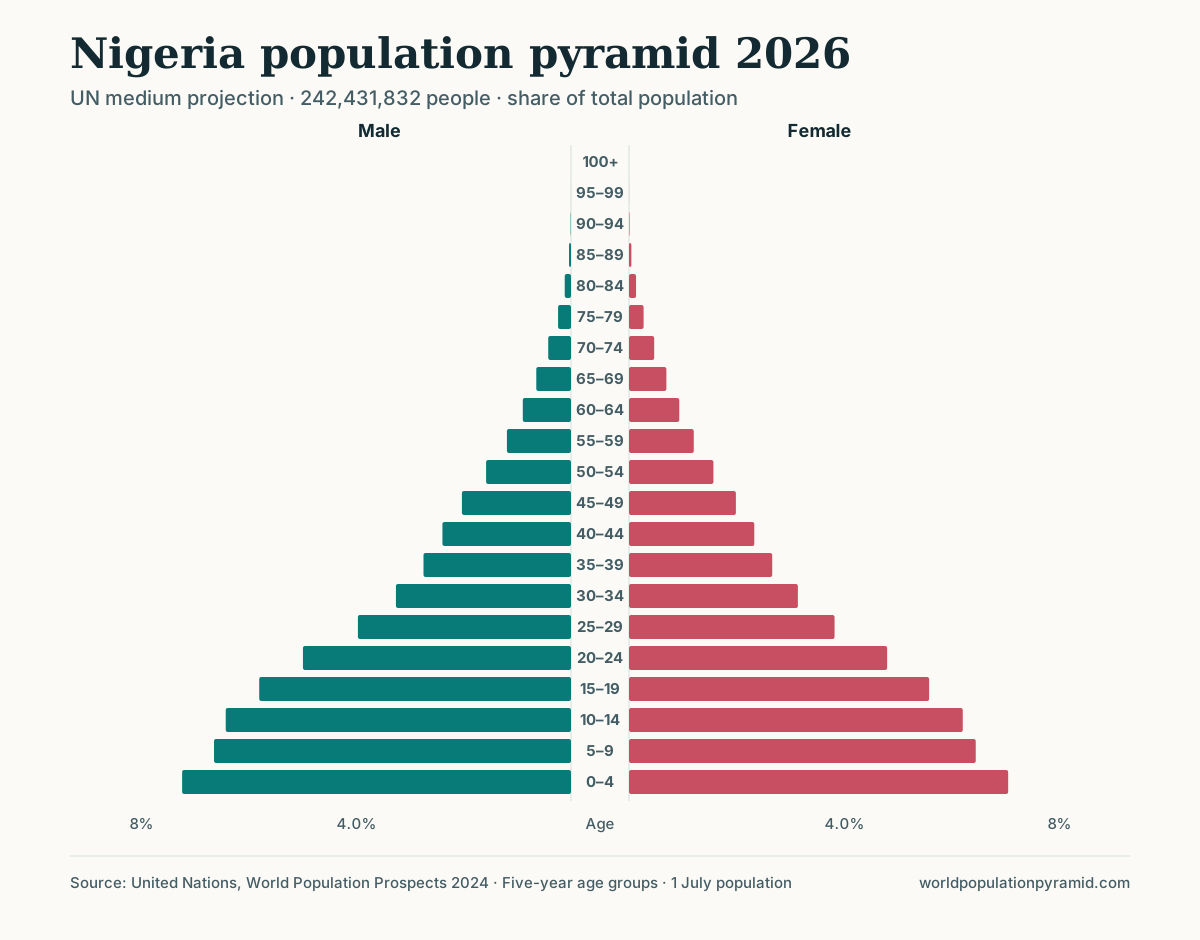
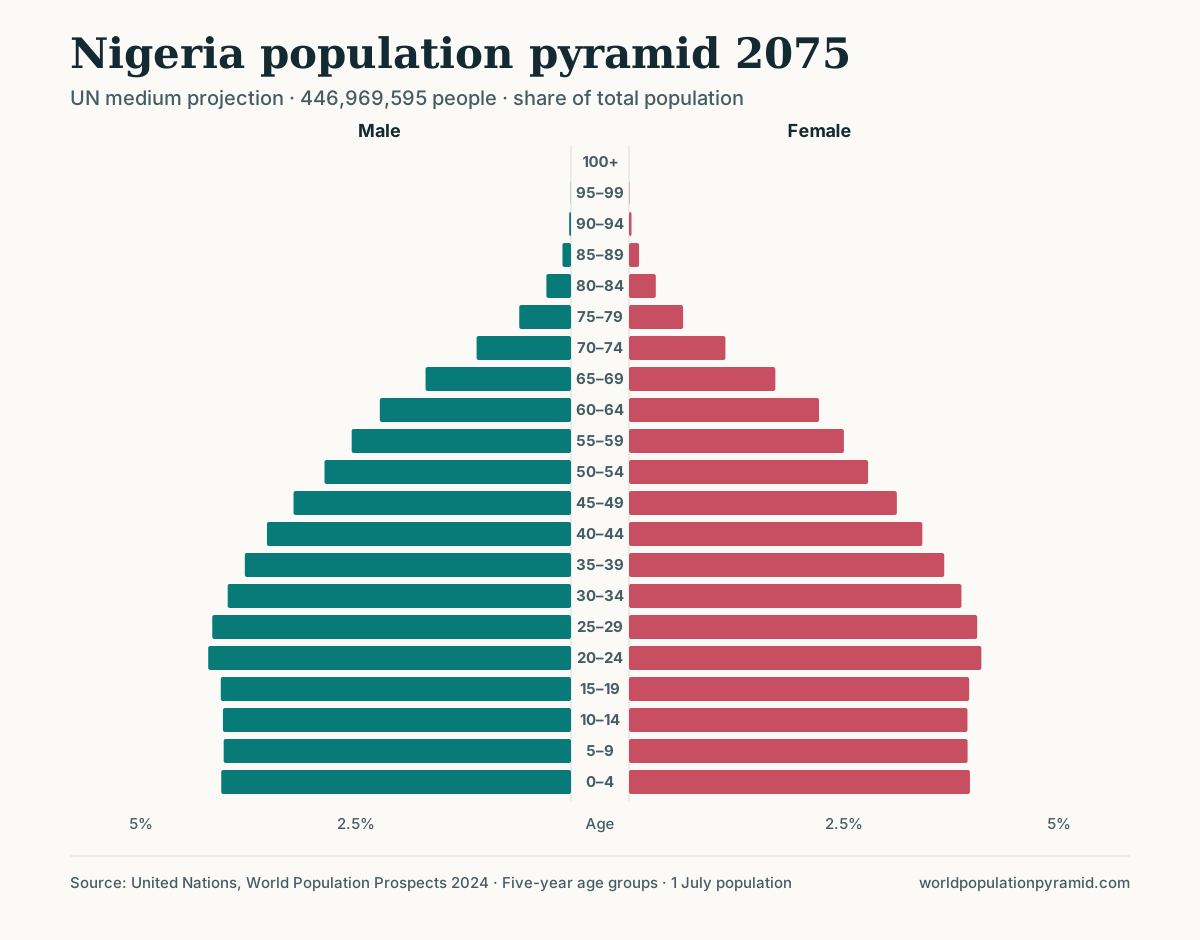
In much of sub-Saharan Africa the window is beginning to open. Nigeria still has a triangular pyramid in 2026: the three largest bands are 0–4, 5–9 and 10–14, and children under 15 make up 40.0% of the population. Fertility is falling, from 6.12 in 2000 to a projected 4.2 in 2026 and 2.66 in 2050. Under the medium scenario the working-age share rises from 56.9% in 2026 to 64.6% in 2050 and about 68% in 2075.
Ethiopia is moving faster. Its fertility fell from 6.65 in 2000 to a projected 3.72 in 2026, and the working-age share rose from 49.6% in 2000 to 58.1% in 2026, with 64.6% projected for 2050. The Nigeria and Ethiopia comparison places the two transitions side by side.
These windows depend on projected fertility decline. If fertility falls more slowly than the medium scenario assumes, the base stays wide and the window opens later and less fully. The size of the opportunity also depends on the conditions listed above: in 2026 Nigeria’s under-five mortality is projected at 100.7 deaths per 1,000 live births, a reminder that health investment is part of the dividend, not a by-product of it.
How to see the window on any country page
- Slide through time. Move the pyramid slider from 1950 to 2100 and watch where the widest bars sit. The window is open while they are between 15 and 64 and the base is narrowing.
- Overlay two years. Use the outline overlay to compare, for example, 2000 with 2050. A base that shrinks inside the outline while the middle expands marks the opening phase.
- Read the shares. The age-distribution section gives the 15–64 share and the dependency ratio for 2026; the “How the population could change” section gives the projected under-15 and 65+ shares for 2050, from which the 15–64 share follows.
- Check fertility in the trend table. The window follows sustained fertility decline. A falling fertility column, together with a narrowing base as you move the slider forward, marks the opening phase.
- Calculate custom ranges. The age-group calculator gives the share for any age range, such as 20–59, which can be closer to actual working ages.
- Compare across countries. The dependency ratio ranking and youngest populations ranking show which countries are at which stage.
Limitations
The 15–64 boundary is a convention. Many people aged 15–24 are in education, many adults are not in paid work, and many people work after 65. Labour-force participation, productivity, and unpaid work are not shown in a pyramid, so the working-age share is a measure of demographic potential, not of employment.
The dividend is also not purely demographic. Migration can widen the working ages without any fertility change, as in the Gulf states; see how migration shapes population pyramids. And projected windows rest on medium-scenario fertility assumptions; how UN projections work explains the uncertainty.
Sources
- UNFPA: Demographic dividend
- Lee and Mason (2006), “What Is the Demographic Dividend?”, Finance & Development, IMF
- United Nations World Population Prospects 2024
- WPP 2024 methodology report
Frequently asked questions
What is the demographic dividend?
It is the potential for faster economic growth that arises when fertility falls and the working-age population (15–64) grows faster than the number of children and older people it supports.
What is the difference between the first and second demographic dividend?
The first comes from a temporarily higher share of people of working age. The second can follow when a population concentrated at older working ages saves and invests for a longer retirement, raising capital per worker.
Is the demographic dividend automatic?
No. A favourable age structure only creates potential. The gains depend on jobs, education, health, women's participation in paid work, and savings and financial institutions.
How long does the demographic window last?
Usually several decades. In South Korea the working-age share rose from 57.9% in 1975 to 71.9% in 2000, and is projected to fall to 52.5% by 2050 as the large cohorts reach 65.