Population Pyramid Classroom Activities with Answers
Ready-to-use population pyramid activities for KS3, GCSE and AP Human Geography, using real UN data, with answer guidance, a printable task list and assessment tips.
These activities turn the site’s country profiles into structured lessons. Each names the pages to open, the tasks to set, and the answers to expect. All numbers come from UN World Population Prospects 2024: values through 2023 are estimates, and later years are medium-scenario projections.
Before the lesson
Students need three ideas first:
- Bars show shares, not counts. Each pyramid plots five-year groups, males and females separately, as a percentage of the total population; hovering over or tapping a bar shows the exact male and female counts for that group. See counts vs percentages.
- Estimates and projections differ. The label beside the chart says which is shown. Any year after 2023 is a projection.
- Shape suggests, data confirms. A pyramid records past births, deaths and migration, but cannot by itself say which caused a feature.
How to read a population pyramid works as preparatory reading.
Activity 1: Describe, explain, predict (KS3, 20 minutes)
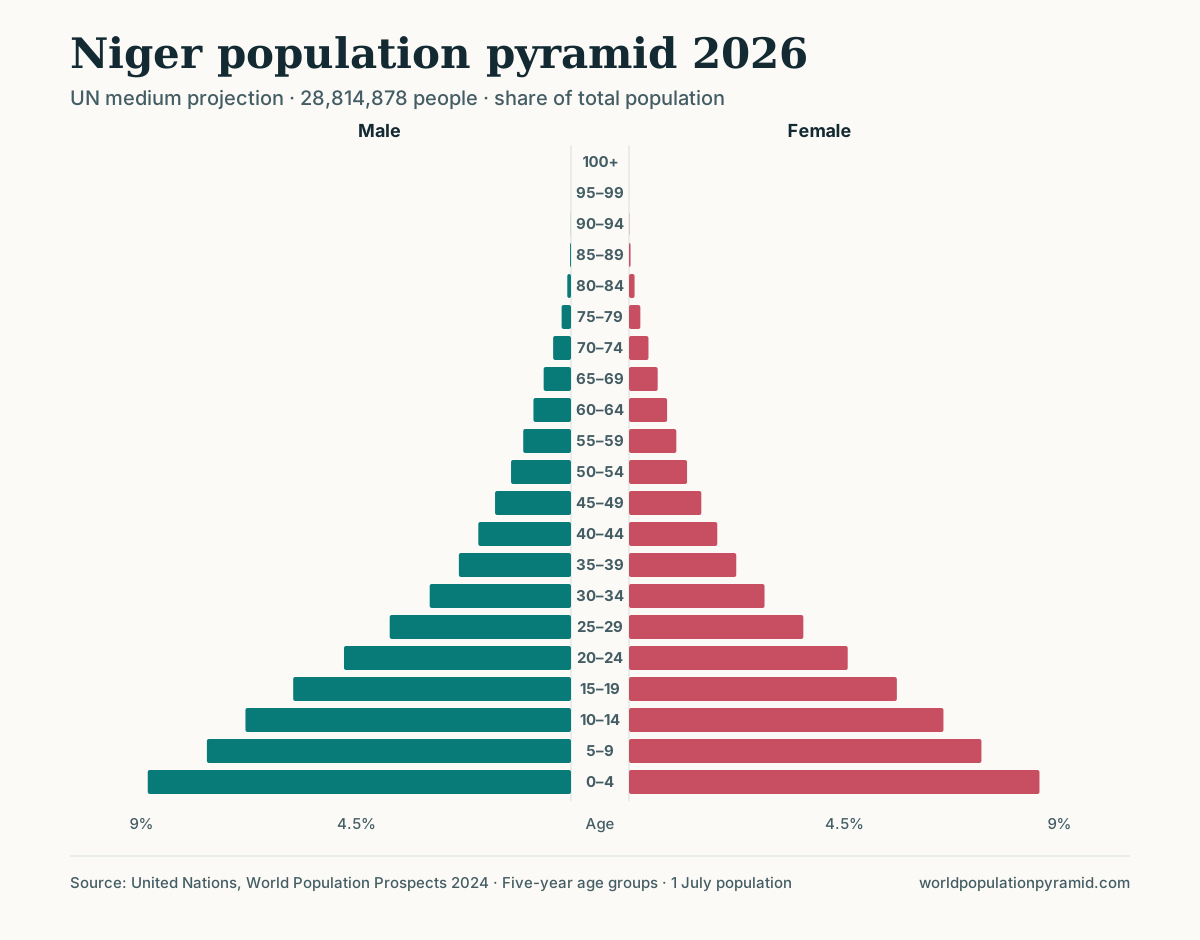
Open the Niger profile at 2026.
- Describe: What is the shape? Which age group is largest? What share is under 15, and what share is 65+?
- Explain: Use the profile’s fertility rate and life expectancy to give two reasons for the shape.
- Predict: Write one sentence about 2050, then move the slider and check.
Answer guidance. The pyramid is expansive: every band is narrower than the one below, and the 0–4 group is largest, at about 17.5% of the population. Under-15s are 45.8%, while those 65+ are only 2.6%. Fertility is 5.64 births per woman, and life expectancy is 61.9 years (61.2 in 2023, the last estimate year). By 2050 the under-15 share is projected at 35.0%, still broad but narrowing, while the population grows from 28.8 million to 52.5 million. Strong answers call 2050 a projection.
Activity 2: Match the shape to the DTM stage (KS3/GCSE, 25 minutes)
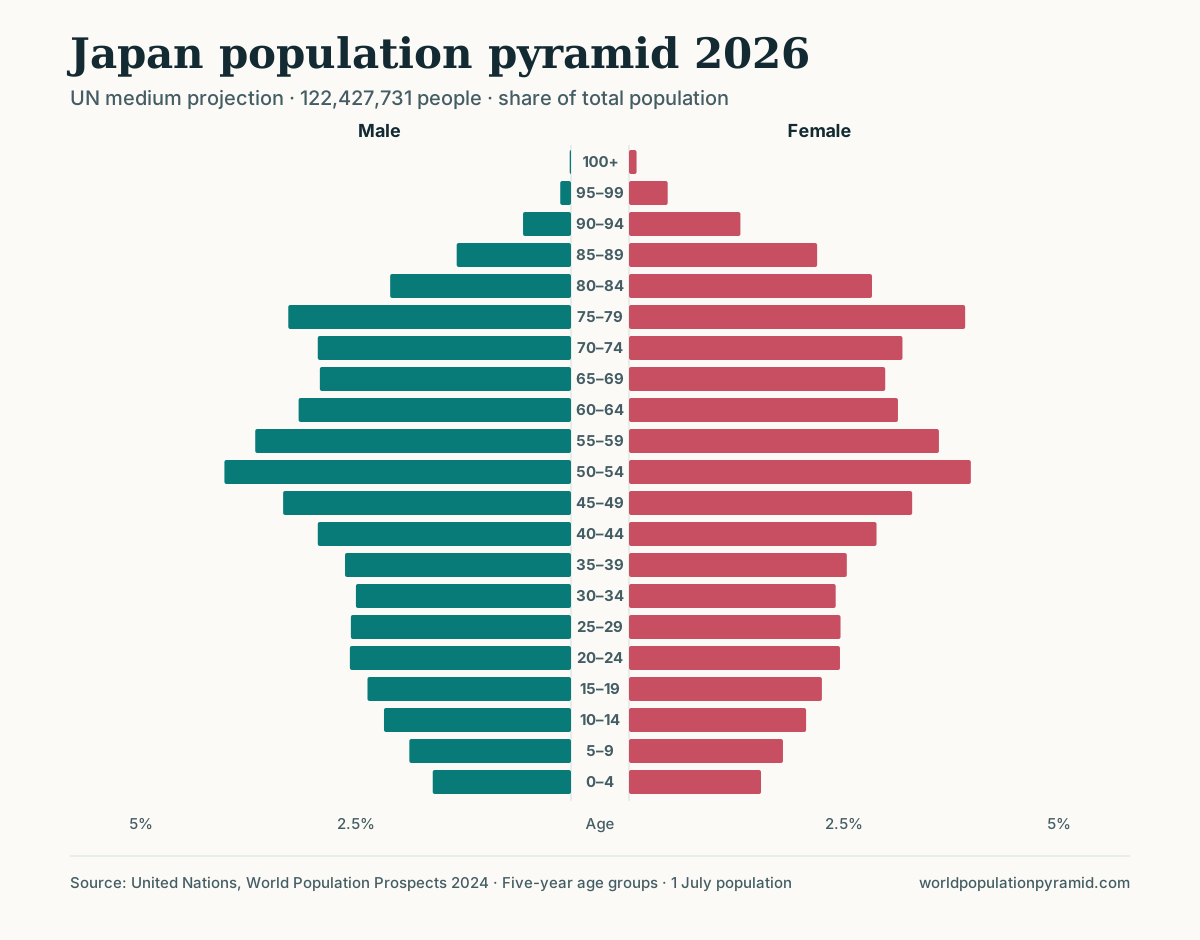
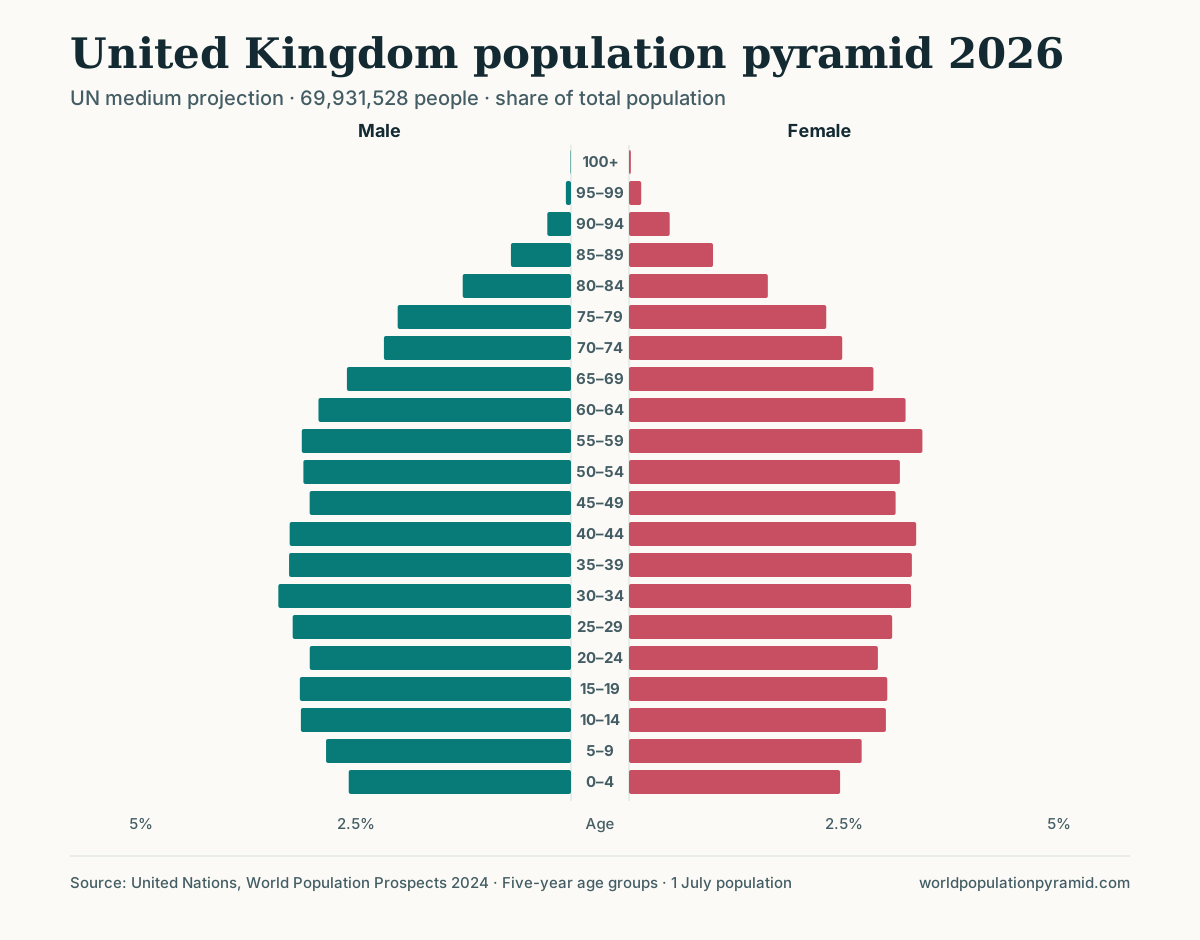
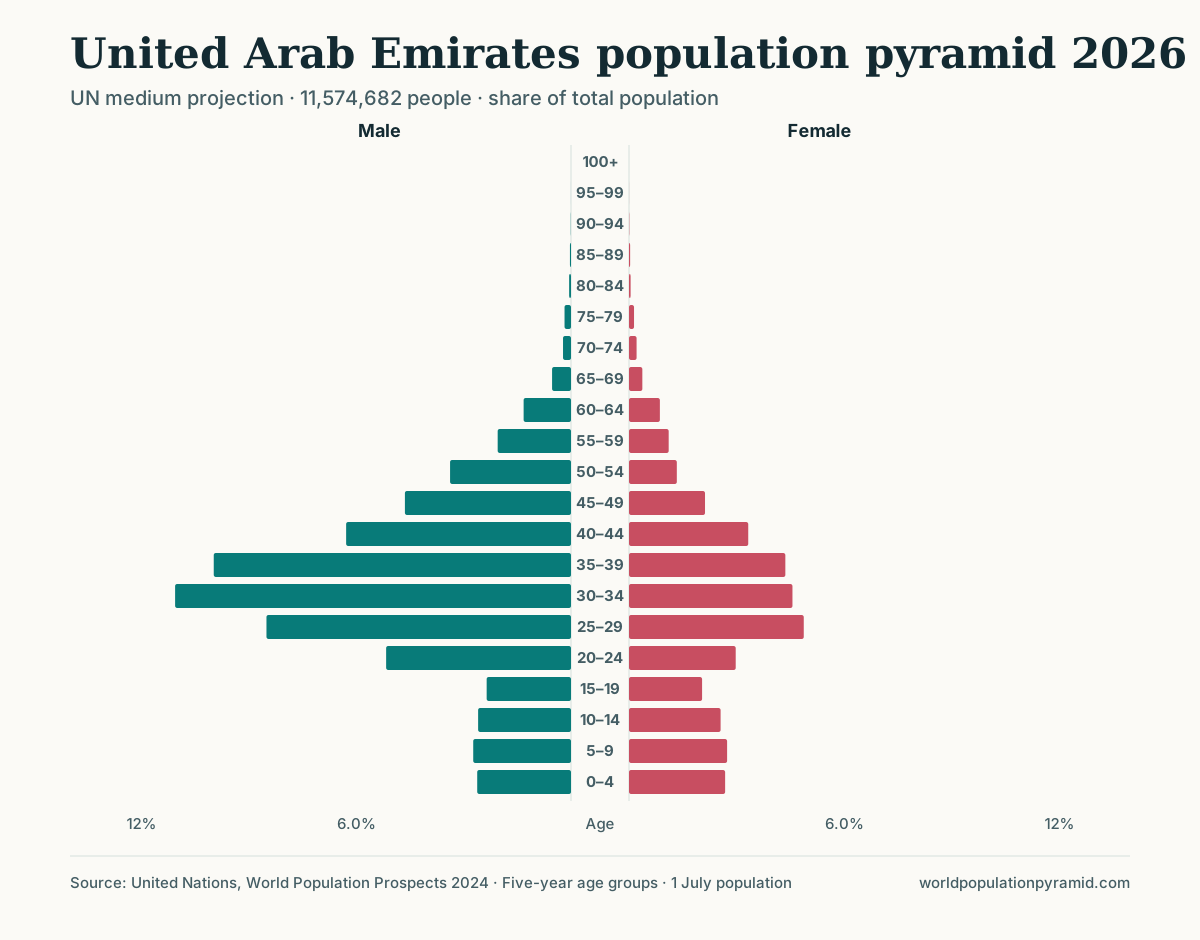
Give students five 2026 pyramids (names hidden if printing). They order them along the demographic transition model and justify each placement with two pieces of evidence from the profile. Births and deaths per 1,000 come from the birth rate and death rate rankings.
| Pyramid (2026) | Under 15 | 65+ | Births / deaths per 1,000 | Suggested placement |
|---|---|---|---|---|
| Niger | 45.8% | 2.6% | 40.2 / 8.4 | Stage 2 to early 3: high births, deaths already low |
| Mexico | 23.7% | 8.8% | 15.0 / 6.3 | Stage 3: largest bands at ages 10–24, base narrowing |
| United Kingdom | 16.7% | 19.9% | 9.7 / 9.7 | Stage 4: low, nearly equal rates |
| Japan | 11.0% | 30.2% | 6.1 / 12.8 | Stage 5 (where used): deaths exceed births |
| United Arab Emirates | 15.9% | 1.8% | 10.3 / 1.0 | Does not fit: shape produced by migration |
Answer guidance. Accept reasoned alternatives, such as “late stage 3” for Mexico. The UAE is a deliberate misfit: its death rate is very low because few residents are old, and its widest bands are working-age men. The best answers say the model does not apply rather than forcing a stage. Stage numbering also differs between textbooks.
Activity 3: Track a birth cohort with the slider (GCSE/AP, 25 minutes)
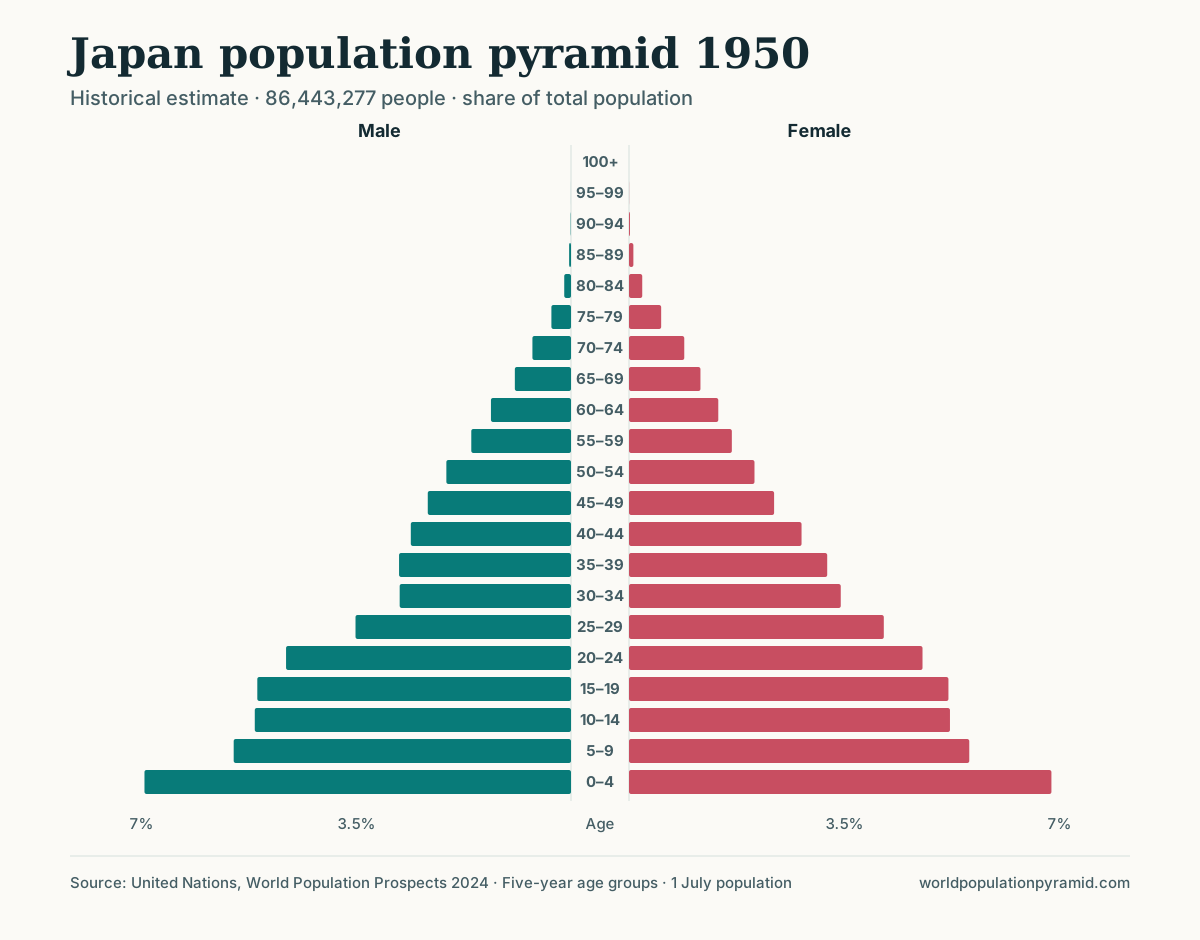
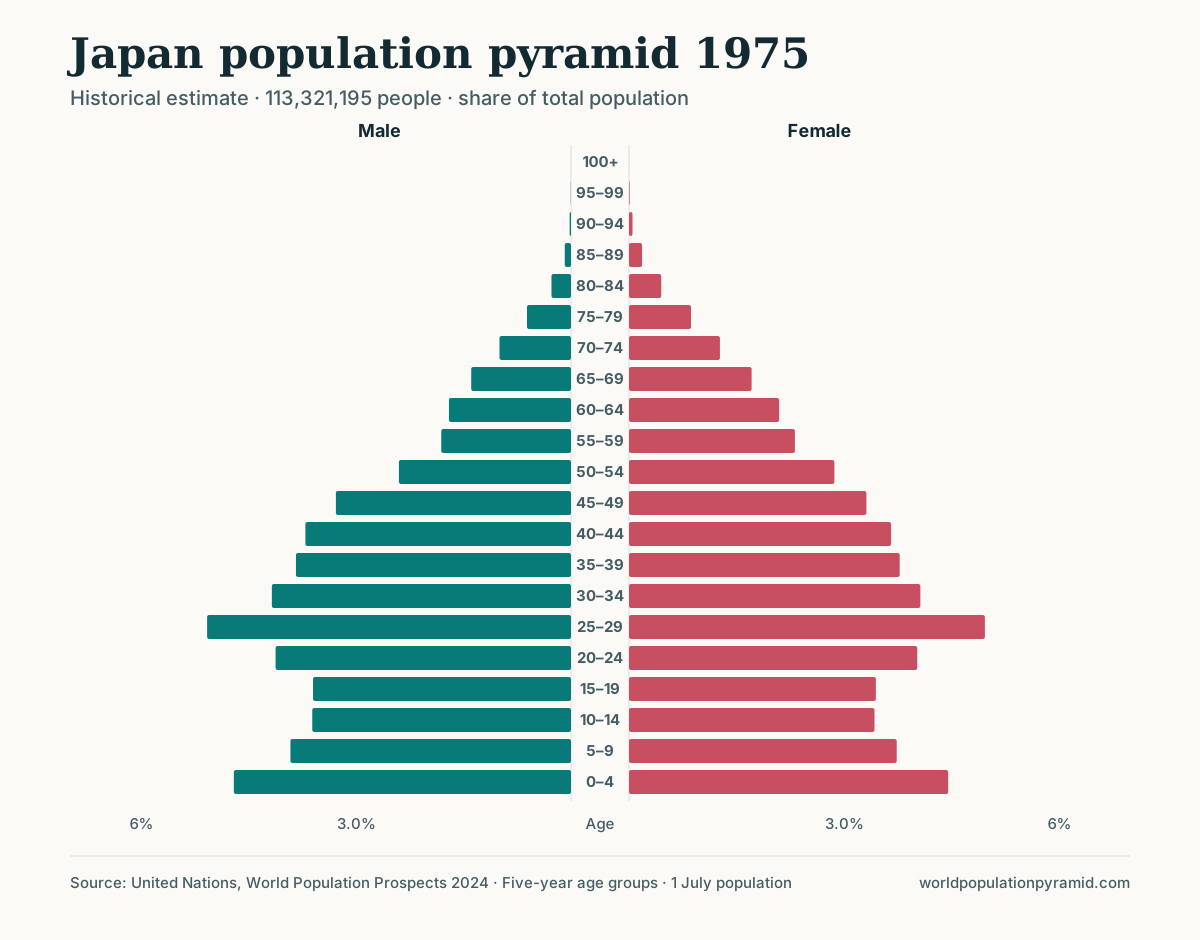
On the Japan profile, students follow one generation in 25-year steps, using the key-year buttons and hovering over the matching band each time; add the male and female counts to get the total. The age-group calculator gives the same totals: enter each year and band in turn.
| Year | Band | People born about 1945–1950 |
|---|---|---|
| 1950 | 0–4 | 11.95 million |
| 1975 | 25–29 | 11.38 million |
| 2000 | 50–54 | 10.80 million |
| 2026 | 75–79 | 8.81 million |
The 2026 band covers births of about 1946–1951, so the last step is approximate.
Questions. Calculate the percentage change at each step. Why does the loss speed up? In 1975, which band below this cohort is also wide, and why?
Answer guidance. The cohort shrinks by about 5% from 1950 to 1975, 5% from 1975 to 2000, and 18% from 2000 to 2026, because mortality rises with age. In 1975 it is the widest band, and the 0–4 band (10.38 million) is wide again: largely its children. That echo cohort reappears as the 50–54 bulge of 2026 (9.80 million), which the “Distinctive cohorts” table lists as about 15% larger than its neighbours, born about 1972–1976. Credit answers noting that migration can also change a cohort’s size, though in Japan it is small.
To check visually, view 2000 with the outline overlay set to 1975: the outline’s widest band sits five bands below the widest bar of 2000.
Activity 4: Compare pairs (GCSE/AP, 30 minutes)
Assign one comparison page per group. Each group gives one similarity, two differences, and one cause supported by data.
- Nigeria vs Japan: median age 18.3 against 50.2; fertility 4.2 against 1.23; growth +2.03% against −0.56% a year.
- Japan vs South Korea: Japan is older in 2026 (65+ shares of 30.2% against 21.4%), but South Korea’s fertility of 0.76 means its 65+ share is projected to pass Japan’s by 2050 (39.7% against 37.5%; check the 2050 shares with the age-group calculator, ages 65 to 100+).
- India vs China: under-15 shares of 23.8% and 14.8% in 2026; by 2050, 65+ shares of 14.7% and 30.9% (from the age-group calculator).
Answer guidance. Reward answers that quote both countries, name the year, and link a difference in shape to fertility, mortality or migration. The Japan–South Korea pair best tests whether students understand that today’s shape is not tomorrow’s.
Activity 5: Calculator tasks (GCSE/AP, 20 minutes)
The age-group calculator adds up a chosen range of five-year bands for any country and pyramid year, giving the count and share of the population.
- For Japan in 2026, find the population aged 0–14 and aged 80+.
- Calculate Japan’s total and old-age dependency ratios from the 0–14, 15–64 and 65+ shares.
- Repeat for Niger and the United Kingdom, then rank the three.
Answer guidance. Japan has about 13.52 million aged 0–14 and 13.44 million aged 80+, each about 11.0% of the population. With 58.8% aged 15–64, its total dependency ratio is about 70 and its old-age ratio about 51. Niger’s total is about 94, almost all from children (89); the United Kingdom’s is about 58. Extension: similar totals can describe very different societies.
Activity 6: Births, deaths and migration (AP extension, 15 minutes)
On the United Kingdom profile, read the births, deaths, and migration chart. In 2026, births (678,001) and deaths (677,695) are almost equal, yet the population grows by 0.52%. Students explain why, then use the countries where deaths exceed births ranking to list candidates and the growth rate ranking to find one whose population still grows. Belgium works: 8.6 births and 9.8 deaths per 1,000, net migration of +2.5 per 1,000, and growth of 0.12%. Follow up with the natural decrease guide.
Printable task list
- Note whether the chart year is an estimate or a projection.
- Describe the shape with three numbers: under-15 share, 65+ share, largest band.
- Explain it using fertility, life expectancy and net migration from the profile.
- Predict 2050, then move the slider to check.
- Use the outline overlay to compare two years; name the band that changed most.
- Give the birth years of one bulge or notch from the “Distinctive cohorts” table.
- Calculate one dependency ratio with the age-group calculator.
- Conclude by separating what the chart shows from what you infer.
Assessment tips
- Mark describe and explain separately. Description earns credit for data with units and years; explanation for a process linked to that data.
- Require figures. “The base is wide” is weaker than “45.8% are under 15.”
- Penalise causal leaps. A notch or bulge does not prove a war, famine or baby boom without other evidence.
- Check percent vs count. A narrow bar in a large country can hold more people than a wide bar in a small one.
- Credit uncertainty. Calling 2050 figures projections, and noting that migration assumptions can change, is the evaluative skill GCSE and AP mark schemes reward.
- Avoid the stage trap. Explaining why a country does not fit the DTM is higher-level thinking than forcing a stage.
Limitations to share with students
Five-year bands hide single-year detail, and national pyramids hide regional differences. The UN revises its estimates in every edition, so figures in older textbooks will not match. The DTM is a descriptive model based largely on European history, not a forecasting tool.
Sources
- United Nations World Population Prospects 2024
- United Nations WPP 2024 methodology report
- College Board: AP Human Geography course (Unit 2, Population and Migration Patterns and Processes)
- Department for Education: national curriculum in England, geography programmes of study
- AQA GCSE Geography (8035) specification
- Population Reference Bureau: glossary of demographic terms
Frequently asked questions
What age group are these activities for?
They are written for students aged roughly 11–16 (KS3 and GCSE) and for AP Human Geography. Activities 1–3 suit KS3; activities 4–6 add the quantitative and evaluative work expected at GCSE and AP level.
Do students need accounts or software?
No. Every task uses free public pages on this site, including country profiles, comparison pages, rankings and the age-group calculator.
Are the answers fixed?
The figures are fixed for the UN World Population Prospects 2024 data used here. Values after 2023 are medium-scenario projections, so answers about the future should be framed as projections, not facts.
Which pyramids work best for matching to DTM stages?
Niger, Mexico, the United Kingdom and Japan in 2026 give a clear sequence. Add the United Arab Emirates as a deliberate misfit to show where the model breaks down.