Tunisia population pyramid 2026
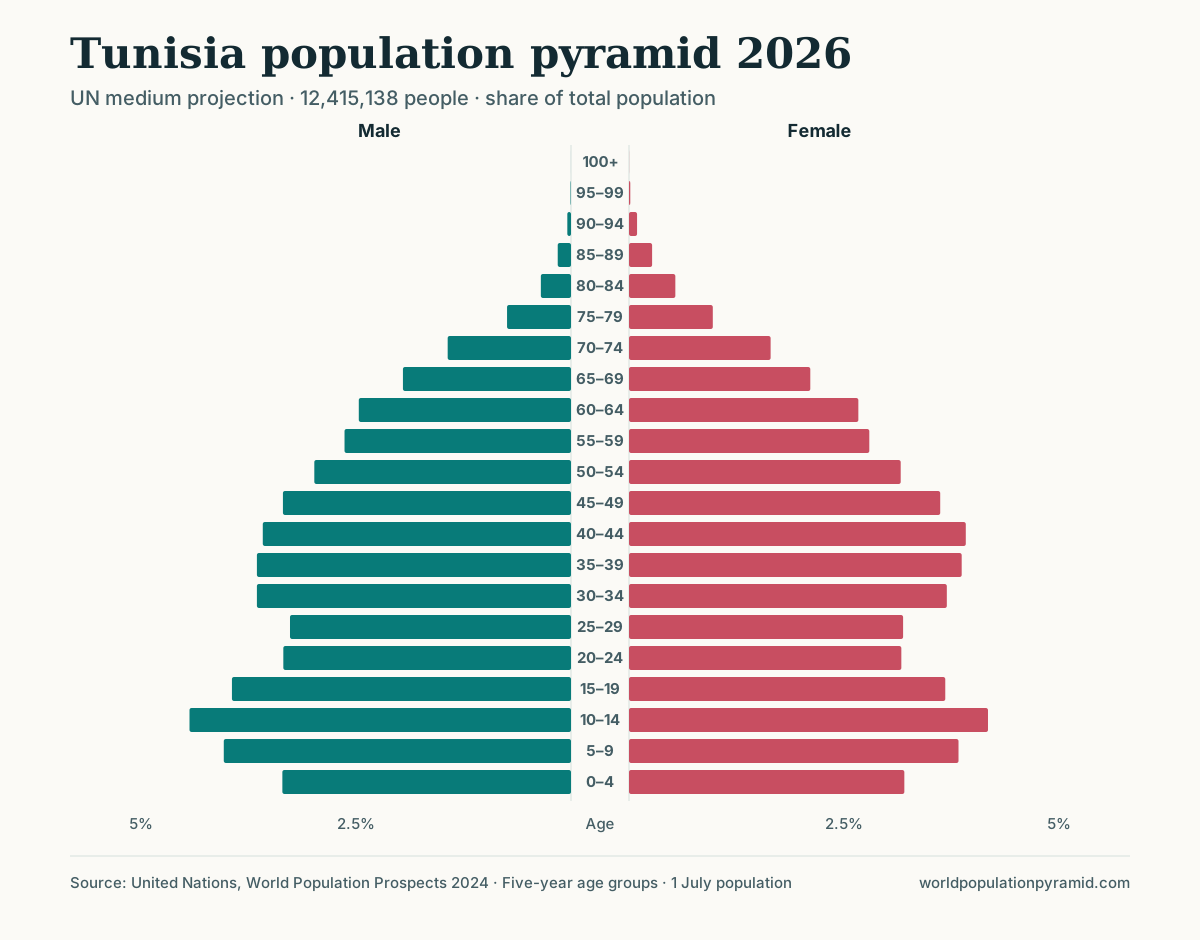
12,415,138 people in 2026 (projected). Tunisia’s pyramid has a wavy profile: fertility fell from seven to replacement in 40 years, and a 2010s birth bulge now sits between two narrower bands.
- 2026 population
- 12.4Mrank 81 of 237
- Median age
- 33.4 yearsoldest rank 116
- Fertility rate
- 1.79births per woman · below replacement
- Structure
- Transitional10.3% age 65+
Tunisia population pyramid
2026 · Share of total by five-year age group and sex
Hover over or tap a bar to see exact values.
Download this population pyramid
Use the publication-ready SVG, create a high-resolution PNG, or download the complete age-by-sex dataset.
The UN series provides historical estimates through 2023. Figures from 2024 onward—including 2026—are medium-scenario projections, not counts or predictions guaranteed to occur.
Tunisia age distribution in 2026
Children under 15 account for 23.0% of the population, while 10.3% are aged 65 or older. The remaining 66.6% are in the conventional working-age range of 15–64. On these shares, the site classifies Tunisia’s age structure as transitional; the guide to population pyramid types explains what that shape implies.
The total age dependency ratio is 50.1: about 50 people under 15 or 65+ for every 100 people aged 15–64 (34.6 children and 15.5 older people). This is an age-balance indicator, not a literal count of economic dependants per worker.
What shapes Tunisia’s population pyramid
Forty years from seven children to two
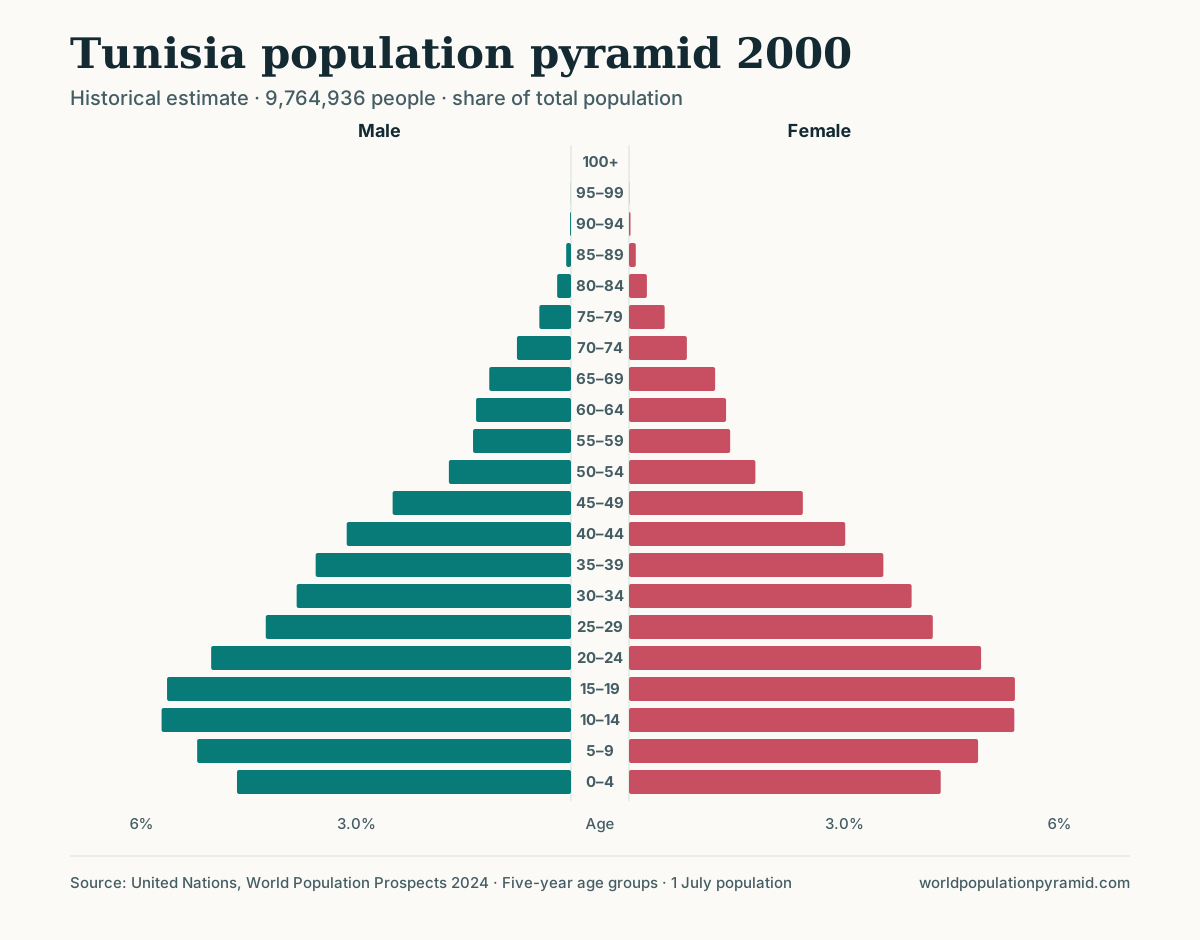
Tunisia’s fertility decline was one of the fastest and earliest in the Arab world. The total fertility rate was about 7.2 in 1960 and had fallen to 2.0 by 2000. The 1956 Code of Personal Status, which banned polygamy and set a minimum marriage age, and a national family planning programme launched in the 1960s are widely credited with laying the ground for that change, alongside rising female education. Mortality fell just as steeply: life expectancy rose from about 38 in 1950 to about 69 by 1990.
The pyramid shows the turning point clearly. In 2000 the widest band was 10–14, the children of the late 1980s, and the 0–4 band was about a fifth smaller. The large cohorts of the 1980s and early 1990s are now aged roughly 30–44 and form the broad middle of the 2026 pyramid, sitting above a trough at ages 20–29, born about 1997–2006, after fertility had fallen to around replacement level.
An echo in the 2010s
The most unusual feature of the 2026 pyramid is a bulge at ages 10–14, about 11% larger than its neighbours. These children were born about 2012–16, when the large 1980s generation was in its peak childbearing years, so part of the bulge is an echo of their numbers; a temporary rise in birth rates in the early 2010s may also have contributed, though the chart alone cannot separate the two. Births have since fallen back, leaving the 0–4 band the narrowest below age 20. The guide to replacement-level fertility explains why a population can keep such waves for generations even when fertility hovers close to two.
Fewer men in the middle years
Women outnumber men in every band from 30–34 upwards, with about 92 men per 100 women at ages 40–44. Tunisia has a long history of labour emigration, much of it by men to France and other European countries, and the UN estimates net outflows of about 830,000 between 1950 and 1999 and about 430,000 between 2000 and 2023, a pattern that fits the shortfall.
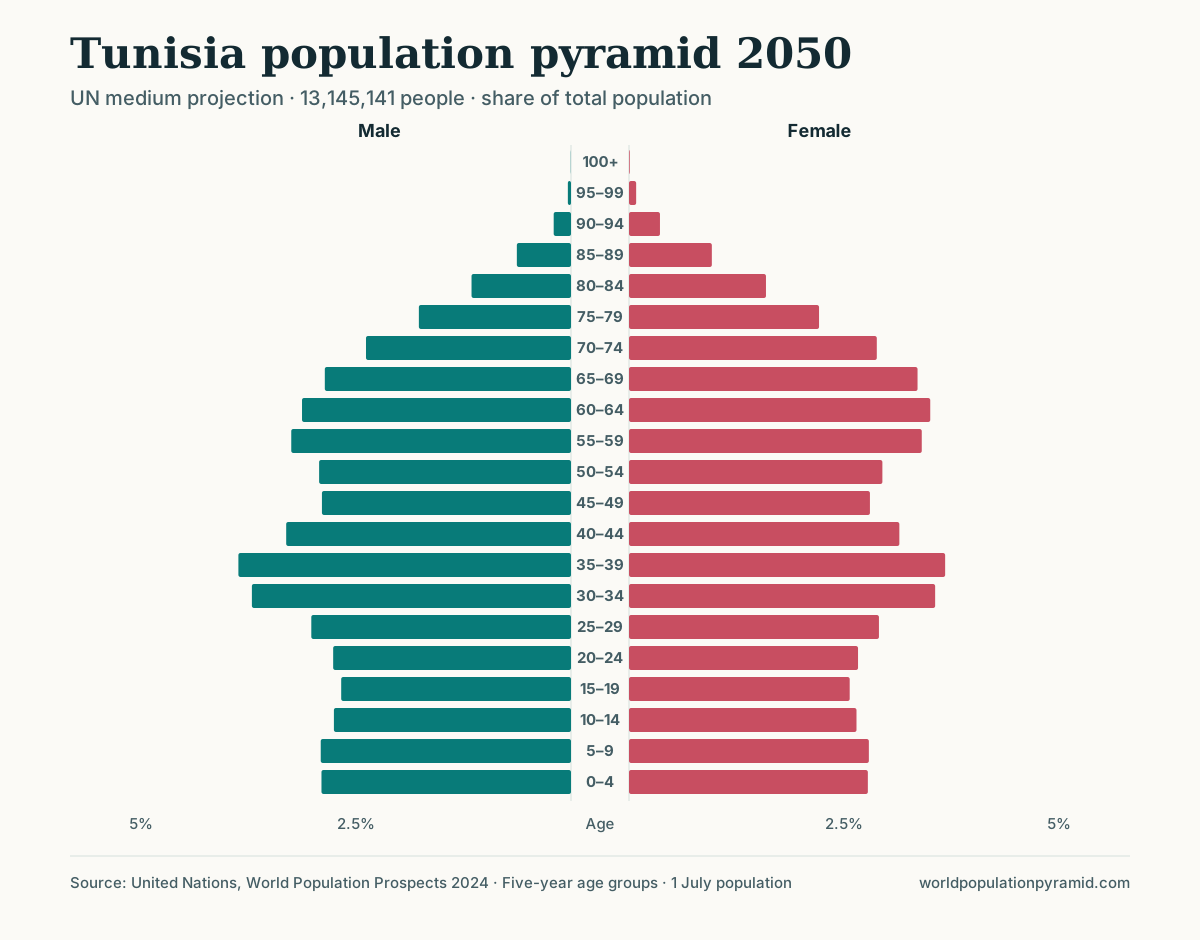
Tunisia’s current profile is close to those of Vietnam, Turkey and Sri Lanka. Under the medium scenario the population peaks in 2051 at about 13.1 million, and deaths first outnumber births in 2055. By 2050 the 1980s and 2010s generations form two separate humps at ages 55–64 and 30–39, and about one Tunisian in five is 65 or older.
What to notice across the years
Distinctive cohorts and turning points
Comparing each five-year band with its neighbours picks out the cohorts that break a smooth slope. These irregularities usually record past surges or deficits in births, or migration concentrated at particular ages; the pattern alone does not identify which. The guide to baby booms and echo cohorts explains how to date and interpret them.
| Age band in 2026 | Born about | Feature | Versus neighbouring bands |
|---|---|---|---|
| 10–14 | 2012–2016 | Bulge (larger cohort) | +11% |
Births outnumber deaths in 2026; the medium scenario projects deaths to exceed births from 2055. People aged 65 and older are projected to outnumber children under 15 by 2045.
Births, deaths, and migration
A pyramid changes in only three ways: births add to the base, deaths remove people at every age, and migration adds or removes people mainly in young adulthood. In 2026, Tunisia is projected to record 156,979 births (about 430 births a day) and 78,286 deaths, a natural increase of 78,693. Net migration adds −14,794 people, ranking #156 in the net migration rate ranking.
Between 2000 and 2023 the UN estimates 4,499,185 births, 1,535,784 deaths, and cumulative net migration of −434,796. Over that period the balance of births and deaths moved the total more than migration did. See how migration shapes a pyramid and birth rate versus fertility rate. The medium scenario assumes net migration of −421,689 between 2026 and 2050.
Annual values 1950–2100; dashed lines after 2023 are the UN medium projection. The trend table below lists the values by decade.
Life expectancy and mortality
- Life expectancy, women
- 79.7 years39.2 in 1950
- Life expectancy, men
- 74.6 years37.2 in 1950
- Further years at 65
- 16.7 yearsboth sexes
- Infant mortality
- 8.7per 1,000 births · 183 in 1950
- Under-five mortality
- 10.6per 1,000 births
- Mother’s mean age at birth
- 31.4 yearssex ratio at birth 104.9
Women in Tunisia are projected to live 5.1 years longer than men, which is why the female side of the pyramid widens relative to the other at older ages (see the life expectancy gap ranking). Infant mortality has fallen from 183 to 8.7 deaths per 1,000 live births since 1950, ranking #126 of 237 in the infant mortality ranking (highest first). A mean age at childbearing of 31.4 years sets the spacing between generations, and so how far apart echo cohorts sit in the pyramid.
Median age, fertility rate, and global ranks for Tunisia
The median age of 33.4 years splits the population into two equal halves. A total fertility rate of 1.79 births per woman is below the replacement level of roughly 2.1, and life expectancy at birth is 77.1 years.
These ranks compare all 237 countries and areas in this dataset using the same 2026 UN medium projection. Ranks use the stored source precision, so displayed rounding can make adjacent values look identical; small differences should not be overinterpreted.
| Indicator | 2026 value | Global rank | Ranking direction |
|---|---|---|---|
| Population | 12,415,138 | #81 | Largest first |
| Median age | 33.4 years | #116 | Oldest first |
| Fertility rate | 1.79 | #125 | Highest first |
| Annual growth | +0.5% | #132 | Fastest first |
| Life expectancy | 77.1 years | #103 | Highest first |
| Population aged 65+ | 10.3% | #116 | Highest share first |
Largest age groups in Tunisia
The five largest cohorts identify where the 2026 population is concentrated. They can reflect past birth patterns, survival, and migration; the chart alone does not establish which cause dominates.
| Rank | Age group | Population | Share of total | Male / female |
|---|---|---|---|---|
| 1 | 10–14 | 1,068,995 | 8.6% | 550.7K / 518.3K |
| 2 | 5–9 | 976,963 | 7.9% | 501.3K / 475.7K |
| 3 | 15–19 | 946,059 | 7.6% | 489.5K / 456.6K |
| 4 | 35–39 | 933,721 | 7.5% | 453.4K / 480.3K |
| 5 | 40–44 | 931,155 | 7.5% | 445K / 486.2K |
Sex ratio and the balance by age
In the 2026 projection, Tunisia has 6,132,410 males and 6,282,729 females. That is 97.6 males per 100 females, ranking #135 when the dataset is ordered from the highest male-to-female ratio to the lowest.
Males account for 49.4% of the population and females for 50.6%. There are 150,319 more females than males overall. Among people aged 65 and older, the ratio is 83.0 males per 100 females.
The overall balance can conceal large differences by age; how sex ratios change with age explains the usual pattern. The ratio reflects the male/female categories in the UN source and is not a measure of gender identity. Compare all profiles in the sex-ratio ranking.
At birth, 104.9 boys are projected to be born for every 100 girls in 2026, close to the biological norm of about 105 (compare the sex ratio at birth ranking). The ratio at birth sets the balance at the base of the pyramid; how it changes with age then depends on survival and migration.
How Tunisia has changed since 1950
The population has increased from 3,608,985 in 1950 to 12,415,138 in 2026, a change of 244%. Over the same span, median age moved from 19.1 to 33.4 years.
The under-15 share changed from 40.4% to 23.0%, while the share aged 65 and older changed from 4.4% to 10.3%. These shifts show why total population growth and age-structure change need to be read separately.
How the population could change by 2050
Under the UN medium scenario, Tunisia’s population is projected to grow by about 6%, reaching 13,145,141 in 2050. The median age changes from 33.4 to 40.3 years.
The 65+ share is projected to rise by 10.2 percentage points to 20.5%. At the same time, the under-15 share is projected at 16.8%. How UN projections work explains the assumptions behind these figures.
The annual UN series reaches its highest projected population of 13,148,162 in 2051. That turning point depends on the medium scenario and may move in later revisions. Compare timing across countries in the population peak ranking.
Population trend: 1950–2100
Mid-year population for every year. Estimates through 2023; dashed line shows the UN medium projection.
| Year | Population | Median age | Fertility | Life exp. | Births | Deaths | Net migration | Growth |
|---|---|---|---|---|---|---|---|---|
| 1950 | 3,608,985 | 19.1 | 6.68 | 38.2 | 168,250 | 98,597 | +2,131 | +2.0% |
| 1960 | 4,267,288 | 17.3 | 7.16 | 44.0 | 203,736 | 94,502 | −61,334 | +1.1% |
| 1970 | 5,131,396 | 16.4 | 6.43 | 53.8 | 210,624 | 72,390 | −10,054 | +2.5% |
| 1980 | 6,606,195 | 17.4 | 5.03 | 63.7 | 224,535 | 53,438 | −19,321 | +2.3% |
| 1990 | 8,324,509 | 20.0 | 3.44 | 69.1 | 216,073 | 47,888 | +4,183 | +2.1% |
| 2000 | 9,764,936 | 23.4 | 2.03 | 72.6 | 161,597 | 49,100 | −5,937 | +1.1% |
| 2010 | 10,765,980 | 27.8 | 2.08 | 74.4 | 193,140 | 60,332 | −14,168 | +1.1% |
| 2020 | 11,974,057 | 31.1 | 2.00 | 75.0 | 189,037 | 79,609 | −19,188 | +0.8% |
| 2023 | 12,200,431 | 32.1 | 1.83 | 76.5 | 167,729 | 74,071 | −14,001 | +0.7% |
| 2024* | 12,277,109 | 32.5 | 1.82 | 76.7 | 164,145 | 75,229 | −15,221 | +0.6% |
| 2026* | 12,415,138 | 33.4 | 1.79 | 77.1 | 156,979 | 78,286 | −14,794 | +0.5% |
| 2030* | 12,628,142 | 35.1 | 1.76 | 77.9 | 146,219 | 85,061 | −17,939 | +0.3% |
| 2040* | 12,953,864 | 38.2 | 1.72 | 79.8 | 150,445 | 106,142 | −18,069 | +0.2% |
| 2050* | 13,145,141 | 40.3 | 1.70 | 81.5 | 146,334 | 125,269 | −15,639 | +0.0% |
| 2060* | 12,979,263 | 43.9 | 1.69 | 83.1 | 118,418 | 139,876 | −16,103 | -0.3% |
| 2070* | 12,507,103 | 47.1 | 1.69 | 84.6 | 112,657 | 151,393 | −14,708 | -0.4% |
| 2080* | 11,959,126 | 48.1 | 1.68 | 85.9 | 109,826 | 152,578 | −13,801 | -0.5% |
| 2090* | 11,361,334 | 48.8 | 1.68 | 87.2 | 93,735 | 146,246 | −12,524 | -0.6% |
| 2100* | 10,652,235 | 50.7 | 1.67 | 88.3 | 84,718 | 149,254 | −12,306 | -0.7% |
* 2024 onward is the UN medium projection. Fertility is births per woman; life expectancy is years at birth; births, deaths, and net migration are counts for that calendar year.
Download every year, 1950–2100 (CSV)
2026 population by age and sex
The table provides the counts behind the chart. Age groups are five-year bands, with everyone aged 100 or older combined.
| Age group | Male | Female | Total | Share |
|---|---|---|---|---|
| 0–4 | 416,690 | 397,487 | 814,177 | 6.6% |
| 5–9 | 501,265 | 475,698 | 976,963 | 7.9% |
| 10–14 | 550,745 | 518,250 | 1,068,995 | 8.6% |
| 15–19 | 489,483 | 456,576 | 946,059 | 7.6% |
| 20–24 | 415,295 | 393,151 | 808,446 | 6.5% |
| 25–29 | 405,668 | 395,698 | 801,366 | 6.5% |
| 30–34 | 453,445 | 458,825 | 912,270 | 7.3% |
| 35–39 | 453,443 | 480,278 | 933,721 | 7.5% |
| 40–44 | 444,954 | 486,201 | 931,155 | 7.5% |
| 45–49 | 415,873 | 449,275 | 865,148 | 7.0% |
| 50–54 | 370,565 | 392,242 | 762,807 | 6.1% |
| 55–59 | 326,940 | 346,900 | 673,840 | 5.4% |
| 60–64 | 306,351 | 331,091 | 637,442 | 5.1% |
| 65–69 | 242,630 | 261,728 | 504,358 | 4.1% |
| 70–74 | 178,031 | 204,452 | 382,483 | 3.1% |
| 75–79 | 92,322 | 120,978 | 213,300 | 1.7% |
| 80–84 | 43,529 | 66,898 | 110,427 | 0.9% |
| 85–89 | 19,160 | 33,362 | 52,522 | 0.4% |
| 90–94 | 5,314 | 11,637 | 16,951 | 0.1% |
| 95–99 | 670 | 1,861 | 2,531 | 0.0% |
| 100+ | 37 | 141 | 178 | 0.0% |
Countries with the most similar age structure
These profiles have the 2026 age distributions closest to Tunisia’s, measured by the total difference in the share of the population in each five-year band. Similar shapes can arise from very different histories, so the match is a starting point for comparison, not an explanation.
- Vietnam98% overlap · median age 33.9
- Turkey97% overlap · median age 33.9
- Indonesia96% overlap · median age 30.7
- Sri Lanka96% overlap · median age 33.6
- Azerbaijan95% overlap · median age 34.1
- New Caledonia95% overlap · median age 34.8
To calculate school-age, working-age, or older groups with other boundaries, use the age-group calculator for Tunisia.
Use this chart in your work
Charts and tables may be reused with attribution. Please link to this page and credit the United Nations as the data source.
Embed the population pyramid
Cite this page
APA
World Population Pyramid. (2026, October 19). Tunisia Population Pyramid 2026. https://worldpopulationpyramid.com/countries/tunisia/
MLA
“Tunisia Population Pyramid 2026.” World Population Pyramid, 19 Oct. 2026, worldpopulationpyramid.com/countries/tunisia/.
Chicago
World Population Pyramid. “Tunisia Population Pyramid 2026.” Last modified October 19, 2026. https://worldpopulationpyramid.com/countries/tunisia/.
Underlying data: United Nations, Department of Economic and Social Affairs, Population Division (2024). World Population Prospects 2024.
Frequently asked questions
What is the population of Tunisia in 2026?
Under the UN World Population Prospects 2024 medium scenario, Tunisia's population in 2026 is projected at 12,415,138.
What is the median age in Tunisia?
The projected median age in Tunisia in 2026 is 33.4 years: half the population is younger and half is older.
What is the fertility rate in Tunisia?
The projected total fertility rate in 2026 is 1.79 births per woman, below the replacement level of about 2.1 in low-mortality populations.
Is Tunisia's population projected to grow?
Between 2026 and 2050, the UN medium scenario indicates the population will grow by about 6%, from 12.4M to 13.1M.
What share of Tunisia is aged 65 or older?
In 2026, 10.3% of the projected population is aged 65 or older. By 2050, the medium scenario places the share at 20.5%.
How many babies are born in Tunisia each year?
The UN medium scenario projects 156,979 births and 78,286 deaths in 2026, about 430 births a day. Births exceed deaths by 78,693.
What is life expectancy in Tunisia for men and women?
Life expectancy at birth in 2026 is projected at 79.7 years for women and 74.6 years for men, a gap of 5.1 years in favour of women.
Does Tunisia have more immigrants or emigrants?
Tunisia is projected to lose about 14,794 more people through emigration than it gains in 2026. Between 2000 and 2023 the UN estimates cumulative net migration of −434,796.
What is the sex ratio in Tunisia?
The projected 2026 population sex ratio is 97.6 males per 100 females. This all-age ratio is different from the sex ratio at birth and can vary substantially by age.
Sources and notes
- United Nations, DESA, Population Division: World Population Prospects 2024, medium scenario.
- Population values are mid-year figures. Source values published in thousands are converted to people; displayed figures may imply more precision than is appropriate for planning.
- Historical values through 2023 are estimates. Values from 2024 onward are projections.
- Calculations follow the site methodology.