Tuvalu population pyramid 2026
9,362 people in 2026 (projected). Tuvalu’s pyramid, built from bands of a few hundred people, shows men outnumbering women at every age up to 60 and women far outnumbering men above it.
- 2026 population
- 9.4Krank 230 of 237
- Median age
- 24.1 yearsoldest rank 174
- Fertility rate
- 3.10births per woman · above replacement
- Structure
- Youthful7.5% age 65+
Tuvalu population pyramid
2026 · Share of total by five-year age group and sex
Hover over or tap a bar to see exact values.
Download this population pyramid
Use the publication-ready SVG, create a high-resolution PNG, or download the complete age-by-sex dataset.
The UN series provides historical estimates through 2023. Figures from 2024 onward—including 2026—are medium-scenario projections, not counts or predictions guaranteed to occur.
Tuvalu age distribution in 2026
Children under 15 account for 32.9% of the population, while 7.5% are aged 65 or older. The remaining 59.6% are in the conventional working-age range of 15–64. On these shares, the site classifies Tuvalu’s age structure as youthful; the guide to expansive population pyramids explains what that shape implies.
The total age dependency ratio is 67.9: about 68 people under 15 or 65+ for every 100 people aged 15–64 (55.3 children and 12.6 older people). This is an age-balance indicator, not a literal count of economic dependants per worker.
What shapes Tuvalu’s population pyramid
Small numbers, sharp contrasts
Tuvalu has about 9,400 inhabitants on nine low-lying atolls and reef islands, and most of its five-year bands contain fewer than 1,000 people. A few dozen births, deaths or departures can widen or narrow a band, so features such as the 2026 notch at ages 45–49 and bulge at 55–59 should be read with caution; the guide to counts and percentages explains why small populations look jagged.
The sex pattern is more consistent. Men outnumber women in every band up to 55–59, by about 109–117 to 100, while above 60 women predominate strongly, with 58 men per 100 women at ages 70–74. A gap of seven years between female (71.2) and male (64.2) life expectancy accounts for much of the older imbalance.
Emigration offsets natural growth
Fertility is still about three children per woman and births are more than twice as numerous as deaths, yet the population is no larger than in 2000. Emigration, mainly to New Zealand, Fiji and Australia, removed a net 3,300 people between 2000 and 2023, about a third of today’s population. A 2023 treaty with Australia created a new pathway for permanent migration, and concern about sea-level rise on islands only a few metres above the sea adds uncertainty to any projection. The UN medium scenario assumes smaller outflows and slow growth to about 9,800 in 2050. The age structure is closest to those of Micronesia, Kyrgyzstan and Guyana.
What to notice across the years
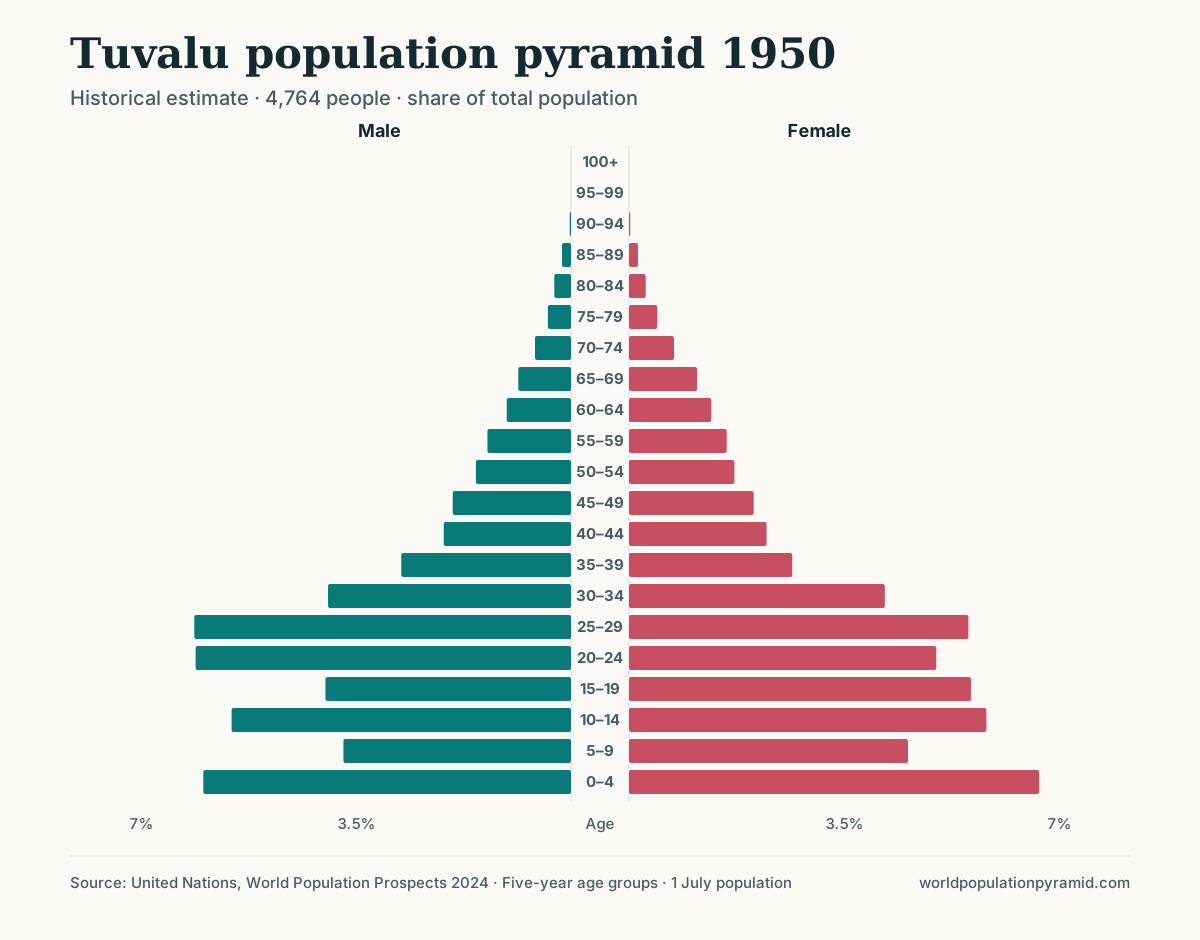
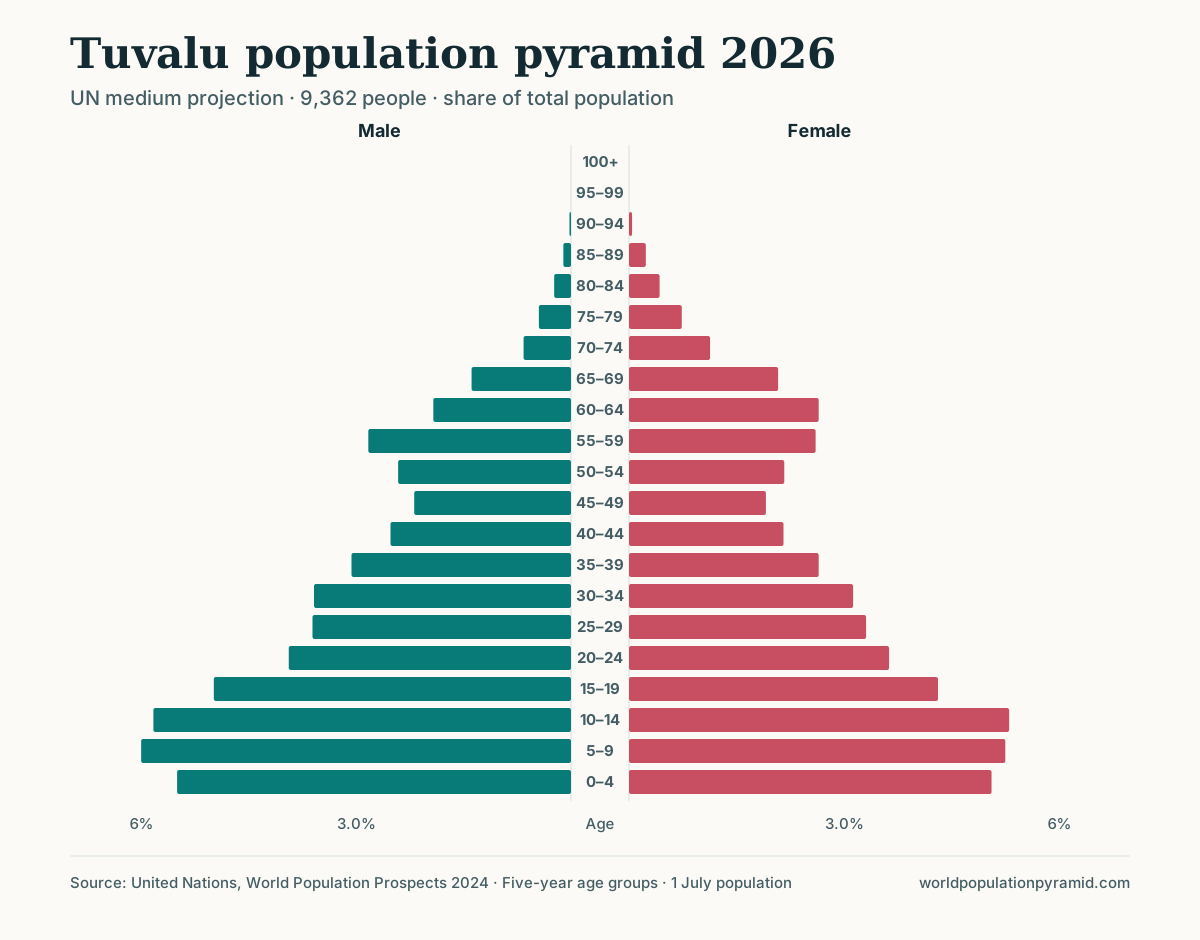
Distinctive cohorts and turning points
Comparing each five-year band with its neighbours picks out the cohorts that break a smooth slope. These irregularities usually record past surges or deficits in births, or migration concentrated at particular ages; the pattern alone does not identify which. The guide to baby booms and echo cohorts explains how to date and interpret them.
| Age band in 2026 | Born about | Feature | Versus neighbouring bands |
|---|---|---|---|
| 55–59 | 1967–1971 | Bulge (larger cohort) | +19% |
| 45–49 | 1977–1981 | Notch (smaller cohort) | −11% |
In the UN medium scenario births outnumber deaths in every year through 2100. Children under 15 outnumber people aged 65 and older in every pyramid year through 2100.
Births, deaths, and migration
A pyramid changes in only three ways: births add to the base, deaths remove people at every age, and migration adds or removes people mainly in young adulthood. In 2026, Tuvalu is projected to record 192 births (about 192 births a year) and 88 deaths, a natural increase of 104. Net migration adds −225 people, ranking #234 in the net migration rate ranking.
Between 2000 and 2023 the UN estimates 5,831 births, 2,345 deaths, and cumulative net migration of −3,288. Over that period the balance of births and deaths moved the total more than migration did. See how migration shapes a pyramid and birth rate versus fertility rate. The medium scenario assumes net migration of −1,889 between 2026 and 2050.
Annual values 1950–2100; dashed lines after 2023 are the UN medium projection. The trend table below lists the values by decade.
Life expectancy and mortality
- Life expectancy, women
- 71.2 years42.9 in 1950
- Life expectancy, men
- 64.2 years37.4 in 1950
- Further years at 65
- 13.7 yearsboth sexes
- Infant mortality
- 15.1per 1,000 births · 159 in 1950
- Under-five mortality
- 18.5per 1,000 births
- Mother’s mean age at birth
- 29.2 yearssex ratio at birth 107.0
Women in Tuvalu are projected to live 7.0 years longer than men, which is why the female side of the pyramid widens relative to the other at older ages (see the life expectancy gap ranking). Infant mortality has fallen from 159 to 15.1 deaths per 1,000 live births since 1950, ranking #79 of 237 in the infant mortality ranking (highest first). A mean age at childbearing of 29.2 years sets the spacing between generations, and so how far apart echo cohorts sit in the pyramid.
Median age, fertility rate, and global ranks for Tuvalu
The median age of 24.1 years splits the population into two equal halves. A total fertility rate of 3.10 births per woman is above the replacement level of roughly 2.1, and life expectancy at birth is 67.6 years.
These ranks compare all 237 countries and areas in this dataset using the same 2026 UN medium projection. Ranks use the stored source precision, so displayed rounding can make adjacent values look identical; small differences should not be overinterpreted.
| Indicator | 2026 value | Global rank | Ranking direction |
|---|---|---|---|
| Population | 9,362 | #230 | Largest first |
| Median age | 24.1 years | #174 | Oldest first |
| Fertility rate | 3.10 | #53 | Highest first |
| Annual growth | -1.2% | #232 | Fastest first |
| Life expectancy | 67.6 years | #195 | Highest first |
| Population aged 65+ | 7.5% | #140 | Highest share first |
Largest age groups in Tuvalu
The five largest cohorts identify where the 2026 population is concentrated. They can reflect past birth patterns, survival, and migration; the chart alone does not establish which cause dominates.
| Rank | Age group | Population | Share of total | Male / female |
|---|---|---|---|---|
| 1 | 5–9 | 1,054 | 11.2% | 562 / 492 |
| 2 | 10–14 | 1,043 | 11.1% | 546 / 497 |
| 3 | 0–4 | 989 | 10.6% | 515 / 474 |
| 4 | 15–19 | 871 | 9.3% | 467 / 404 |
| 5 | 20–24 | 709 | 7.6% | 369 / 340 |
Sex ratio and the balance by age
In the 2026 projection, Tuvalu has 4,796 males and 4,566 females. That is 105.0 males per 100 females, ranking #25 when the dataset is ordered from the highest male-to-female ratio to the lowest.
Males account for 51.2% of the population and females for 48.8%. There are 230 more males than females overall. Among people aged 65 and older, the ratio is 61.5 males per 100 females.
The overall balance can conceal large differences by age; how sex ratios change with age explains the usual pattern. The ratio reflects the male/female categories in the UN source and is not a measure of gender identity. Compare all profiles in the sex-ratio ranking.
At birth, 107.0 boys are projected to be born for every 100 girls in 2026, close to the biological norm of about 105 (compare the sex ratio at birth ranking). The ratio at birth sets the balance at the base of the pyramid; how it changes with age then depends on survival and migration.
How Tuvalu has changed since 1950
The population has increased from 4,764 in 1950 to 9,362 in 2026, a change of 97%. Over the same span, median age moved from 22.7 to 24.1 years.
The under-15 share changed from 32.3% to 32.9%, while the share aged 65 and older changed from 5.0% to 7.5%. These shifts show why total population growth and age-structure change need to be read separately.
How the population could change by 2050
Under the UN medium scenario, Tuvalu’s population is projected to grow by about 4%, reaching 9,780 in 2050. The median age changes from 24.1 to 27.9 years.
The 65+ share is projected to rise by 1.2 percentage points to 8.7%. At the same time, the under-15 share is projected at 27.9%. How UN projections work explains the assumptions behind these figures.
The population is still rising at the end of the UN medium projection in 2100, when it reaches 12,269. The page therefore does not assign a peak year beyond the available horizon.
Population trend: 1950–2100
Mid-year population for every year. Estimates through 2023; dashed line shows the UN medium projection.
| Year | Population | Median age | Fertility | Life exp. | Births | Deaths | Net migration | Growth |
|---|---|---|---|---|---|---|---|---|
| 1950 | 4,764 | 22.7 | 5.42 | 40.0 | 228 | 121 | +70 | +4.5% |
| 1960 | 5,598 | 22.2 | 5.15 | 48.3 | 228 | 103 | −79 | +0.9% |
| 1970 | 5,663 | 17.0 | 4.08 | 55.3 | 173 | 71 | −71 | +0.4% |
| 1980 | 7,366 | 19.8 | 3.73 | 60.2 | 249 | 76 | 0 | +2.4% |
| 1990 | 8,798 | 23.7 | 3.75 | 61.6 | 296 | 93 | −69 | +1.5% |
| 2000 | 9,544 | 22.7 | 3.84 | 63.5 | 254 | 96 | −118 | +0.5% |
| 2010 | 10,614 | 23.0 | 3.44 | 64.8 | 235 | 100 | +22 | +1.6% |
| 2020 | 10,400 | 24.3 | 3.31 | 66.4 | 256 | 95 | −355 | -1.8% |
| 2023 | 9,816 | 24.3 | 3.21 | 67.1 | 226 | 90 | −323 | -1.8% |
| 2024* | 9,646 | 24.3 | 3.17 | 67.3 | 212 | 89 | −280 | -1.7% |
| 2026* | 9,362 | 24.1 | 3.10 | 67.6 | 192 | 88 | −225 | -1.2% |
| 2030* | 9,047 | 23.8 | 2.97 | 68.1 | 172 | 89 | −128 | -0.6% |
| 2040* | 9,140 | 25.3 | 2.69 | 69.4 | 188 | 95 | −45 | +0.5% |
| 2050* | 9,780 | 27.9 | 2.48 | 70.7 | 188 | 96 | −29 | +0.7% |
| 2060* | 10,415 | 29.6 | 2.31 | 72.1 | 170 | 91 | −13 | +0.6% |
| 2070* | 11,057 | 31.1 | 2.19 | 73.4 | 174 | 95 | −13 | +0.5% |
| 2080* | 11,675 | 33.5 | 2.09 | 74.9 | 170 | 105 | −12 | +0.5% |
| 2090* | 12,057 | 36.0 | 2.01 | 76.3 | 157 | 119 | −10 | +0.3% |
| 2100* | 12,269 | 37.4 | 1.95 | 77.7 | 153 | 134 | −5 | +0.2% |
* 2024 onward is the UN medium projection. Fertility is births per woman; life expectancy is years at birth; births, deaths, and net migration are counts for that calendar year.
Download every year, 1950–2100 (CSV)
2026 population by age and sex
The table provides the counts behind the chart. Age groups are five-year bands, with everyone aged 100 or older combined.
| Age group | Male | Female | Total | Share |
|---|---|---|---|---|
| 0–4 | 515 | 474 | 989 | 10.6% |
| 5–9 | 562 | 492 | 1,054 | 11.2% |
| 10–14 | 546 | 497 | 1,043 | 11.1% |
| 15–19 | 467 | 404 | 871 | 9.3% |
| 20–24 | 369 | 340 | 709 | 7.6% |
| 25–29 | 338 | 310 | 648 | 6.9% |
| 30–34 | 336 | 293 | 629 | 6.7% |
| 35–39 | 287 | 248 | 535 | 5.7% |
| 40–44 | 236 | 202 | 438 | 4.7% |
| 45–49 | 205 | 179 | 384 | 4.1% |
| 50–54 | 226 | 203 | 429 | 4.6% |
| 55–59 | 265 | 244 | 509 | 5.4% |
| 60–64 | 180 | 248 | 428 | 4.6% |
| 65–69 | 130 | 195 | 325 | 3.5% |
| 70–74 | 62 | 106 | 168 | 1.8% |
| 75–79 | 42 | 69 | 111 | 1.2% |
| 80–84 | 22 | 40 | 62 | 0.7% |
| 85–89 | 10 | 22 | 32 | 0.3% |
| 90–94 | 2 | 4 | 6 | 0.1% |
| 95–99 | 0 | 0 | 0 | 0.0% |
| 100+ | 0 | 0 | 0 | 0.0% |
Countries with the most similar age structure
These profiles have the 2026 age distributions closest to Tuvalu’s, measured by the total difference in the share of the population in each five-year band. Similar shapes can arise from very different histories, so the match is a starting point for comparison, not an explanation.
- Kyrgyzstan95% overlap · median age 25.5
- French Guiana94% overlap · median age 24.9
- Micronesia93% overlap · median age 23.5
- Guyana93% overlap · median age 26.5
- Egypt93% overlap · median age 24.7
- Samoa93% overlap · median age 19.8
To calculate school-age, working-age, or older groups with other boundaries, use the age-group calculator for Tuvalu.
Use this chart in your work
Charts and tables may be reused with attribution. Please link to this page and credit the United Nations as the data source.
Embed the population pyramid
Cite this page
APA
World Population Pyramid. (2026, October 19). Tuvalu Population Pyramid 2026. https://worldpopulationpyramid.com/countries/tuvalu/
MLA
“Tuvalu Population Pyramid 2026.” World Population Pyramid, 19 Oct. 2026, worldpopulationpyramid.com/countries/tuvalu/.
Chicago
World Population Pyramid. “Tuvalu Population Pyramid 2026.” Last modified October 19, 2026. https://worldpopulationpyramid.com/countries/tuvalu/.
Underlying data: United Nations, Department of Economic and Social Affairs, Population Division (2024). World Population Prospects 2024.
Frequently asked questions
What is the population of Tuvalu in 2026?
Under the UN World Population Prospects 2024 medium scenario, Tuvalu's population in 2026 is projected at 9,362.
What is the median age in Tuvalu?
The projected median age in Tuvalu in 2026 is 24.1 years: half the population is younger and half is older.
What is the fertility rate in Tuvalu?
The projected total fertility rate in 2026 is 3.10 births per woman, above the replacement level of about 2.1 in low-mortality populations.
Is Tuvalu's population projected to grow?
Between 2026 and 2050, the UN medium scenario indicates the population will grow by about 4%, from 9.4K to 9.8K.
What share of Tuvalu is aged 65 or older?
In 2026, 7.5% of the projected population is aged 65 or older. By 2050, the medium scenario places the share at 8.7%.
How many babies are born in Tuvalu each year?
The UN medium scenario projects 192 births and 88 deaths in 2026, about 192 births a year. Births exceed deaths by 104.
What is life expectancy in Tuvalu for men and women?
Life expectancy at birth in 2026 is projected at 71.2 years for women and 64.2 years for men, a gap of 7.0 years in favour of women.
Does Tuvalu have more immigrants or emigrants?
Tuvalu is projected to lose about 225 more people through emigration than it gains in 2026. Between 2000 and 2023 the UN estimates cumulative net migration of −3,288.
What is the sex ratio in Tuvalu?
The projected 2026 population sex ratio is 105.0 males per 100 females. This all-age ratio is different from the sex ratio at birth and can vary substantially by age.
Sources and notes
- United Nations, DESA, Population Division: World Population Prospects 2024, medium scenario.
- Population values are mid-year figures. Source values published in thousands are converted to people; displayed figures may imply more precision than is appropriate for planning.
- Historical values through 2023 are estimates. Values from 2024 onward are projections.
- Calculations follow the site methodology.